

Introduction
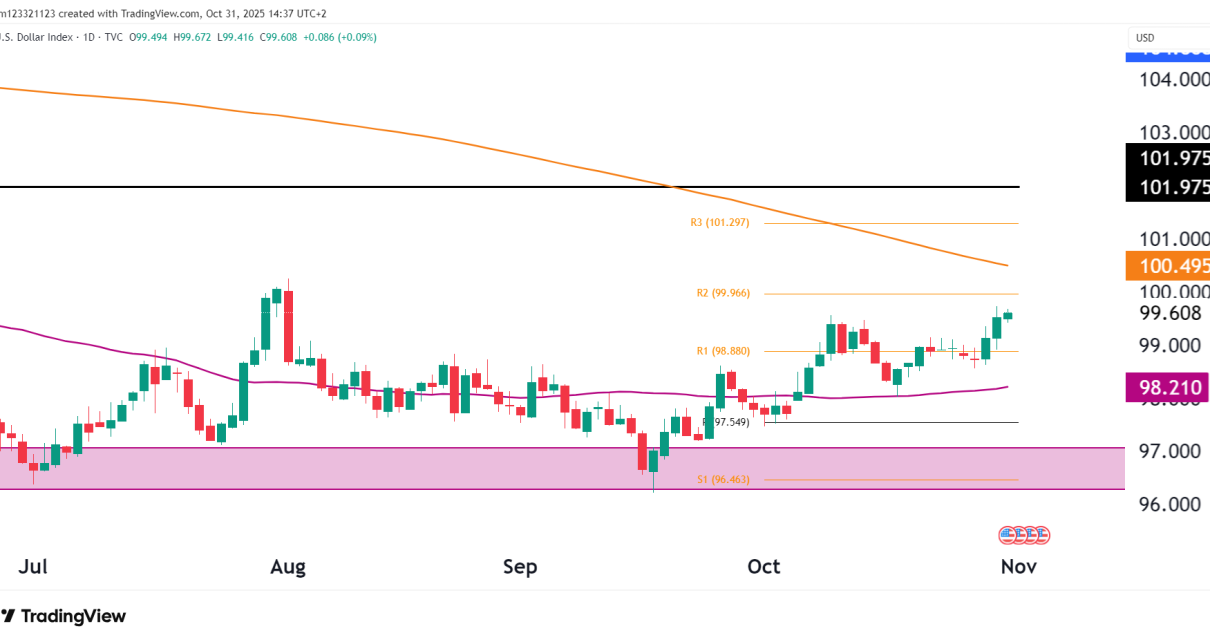
The U.S. Dollar Index (DXY) has continued its recent rebound from October lows near 97.50. The dollar’s renewed strength comes as traders position ahead of this week’s FOMC decision, with market sentiment cautious but leaning toward a continued pause in interest rates. Technically, the dollar is approaching a pivotal resistance zone that could determine whether this recovery gains traction or stalls. Let’s take a deeper look at the technicals and what they tell us.
Technical Overview
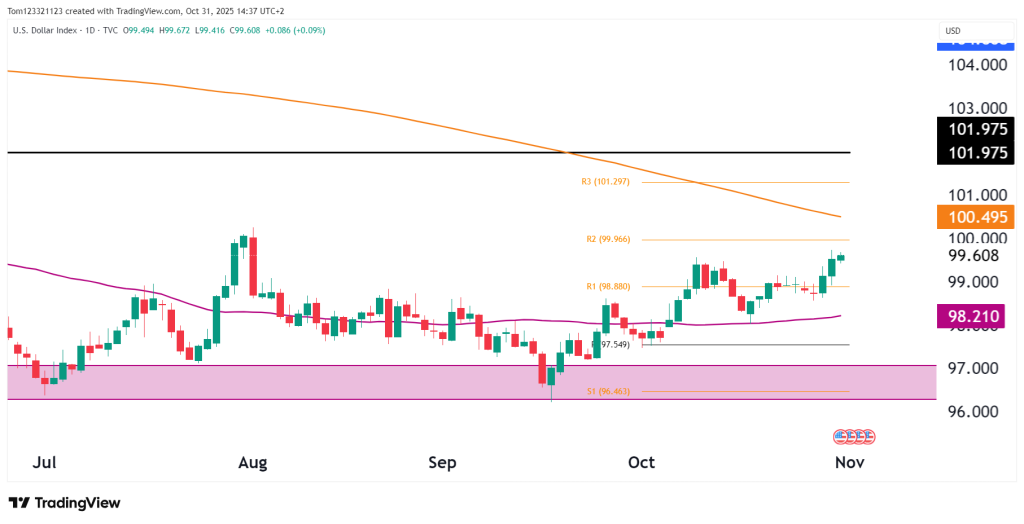
On the daily chart, the U.S. Dollar Index (DXY) has been climbing steadily after bouncing off support near 96.50–97.00 — an area that lines up with the S1 pivot and August lows. Since then, it’s moved above 98.88 (R1) and is now testing the R2 pivot at 99.97, which marks the top of a short-term rising channel.
Looking higher, the 100.50–101.00 zone is key resistance, backed by the 200-day moving average (100.495) and R3 at 101.297. A strong break above this range would signal a bigger trend shift and could lead to a move toward 101.90, a major resistance level, possibly reigniting bullish momentum.
If DXY can’t break above 100.50, it may pull back, with support at 98.20 (50-day moving average), then 97.50 (mid-October low).
For now, the technical picture is improving, but DXY is still in a neutral-to-recovery phase until it holds above its long-term averages.
Key Technical Levels
| Type | Level | Description |
|---|---|---|
| Resistance 1 | 99.97 | R2 pivot / near-term cap |
| Resistance 2 | 100.50 | 200-day MA / key breakout zone |
| Resistance 3 | 101.30–101.90 | R3 + horizontal resistance / July high |
| Support 1 | 98.20 | 50-day MA / former breakout area |
| Support 2 | 97.50 | October swing low |
| Support 3 | 96.46 | S1 pivot / long-term base support |
Probability Table (Next 2–3 Weeks)
| Scenario | Estimated Probability | Notes |
|---|---|---|
| Continuation toward 100.50–101.00 | 50% | Dollar momentum improving ahead of Fed meeting. |
| Short-term consolidation between 98.50–100.00 | 35% | Likely if Fed statement neutral and yields steady. |
| Reversal below 98.00 → retest 97.00 | 15% | Would signal failed breakout and renewed weakness. |
Fundamentals
The dollar is bouncing back as traders position ahead of the upcoming Fed meeting. Rates are expected to stay unchanged, but the Fed’s tone could shift depending on how inflation is tracking. Recent U.S. data shows solid growth and cooling inflation, backing the idea that rates could stay high for longer, which helps support the dollar.
All eyes are on Fed Chair Powell’s comments. If he sounds more dovish, it could push yields down and weaken the dollar. But if he stays cautious, the dollar may keep rising.
Month-end flows and global tensions are also adding to demand for the USD. Still, with gold steady and stocks holding up, the dollar may struggle to break above the 100–101 zone unless Powell delivers a strong message.
Summary
The U.S. Dollar Index is holding steady around 99.60, pushing into key resistance just below 100.50. Momentum has picked up, but the dollar needs to break above the 200-day moving average to confirm a real shift back to a bullish trend.
For now, traders are staying cautious ahead of the Fed’s policy update. The 99–100.50 zone is a critical area — it will help determine if the dollar’s October rebound turns into a longer-term rally or just a short-term bounce.
This analysis is for educational and informational purposes only and does not constitute trading advice or a recommendation to buy or sell any futures contracts. Futures trading involves significant risk and may not be suitable for all investors. Always conduct your own research and consult with a licensed financial professional before making trading decisions.
