

Introduction
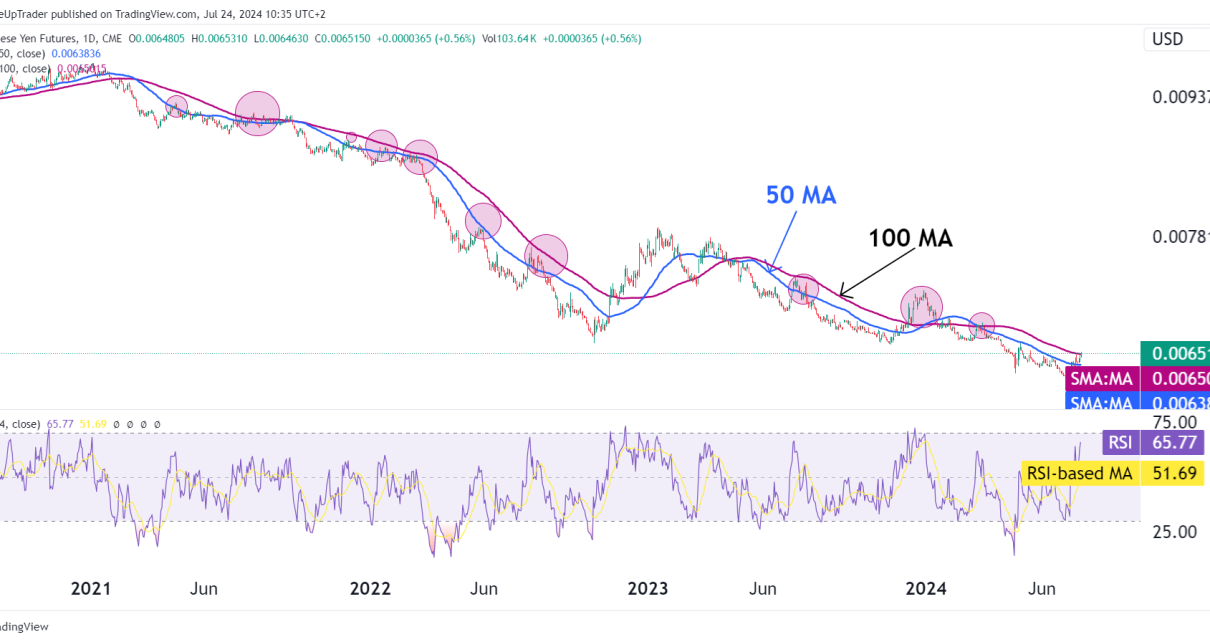
There is an interesting pattern on the 6J daily chart that we could take advantage of. Since the middle of 2021, the Yen has been in a downtrend compared to the Dollar, but we want to look at the retracements during that period.
Putting a 50 and 100 sma on the chart, there is a pattern where each time the retracement occurs into the zone or just above it that the sma forms, the bears step in once more and the price moves down. The small rallies we see are likely short squeezes that run out of steam very quickly.
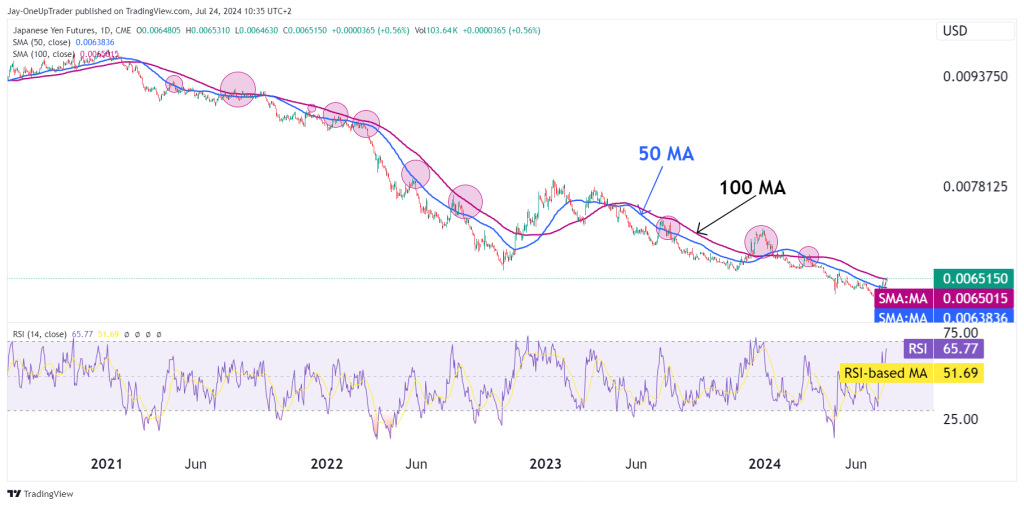
The RSI is just there to help out, but it is not something we need in order to take the position. A good way of entering into the short is to slowly build a position as the price rallies into the SMA zone, placing a reasonable stop loss based on your risk.
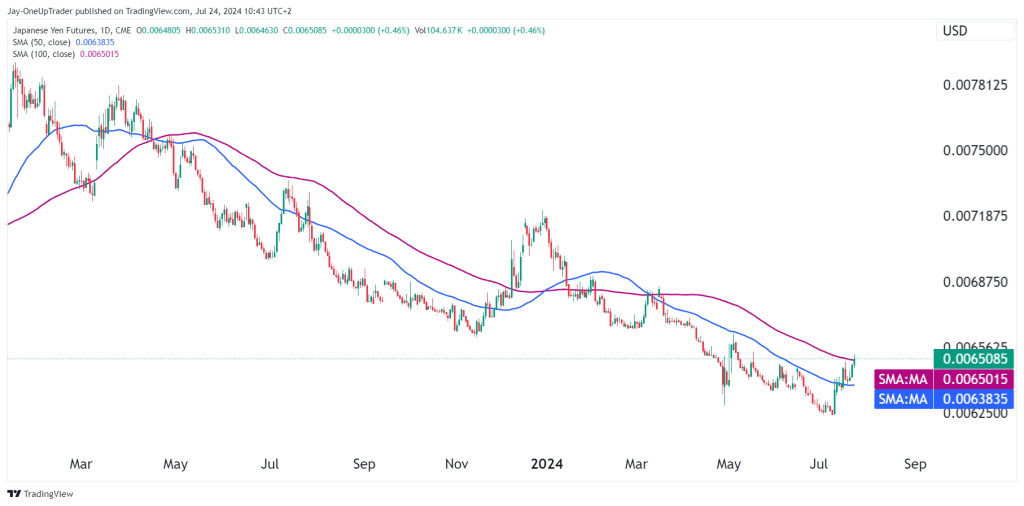
Another method could be to wait for a strong bearish reversal bearish candle where a stop can be placed above.
Even if the price rallies above both smas, the pattern so far has been that the price will reverse and drop once more but keep strict management rules in place. We can look for target around the previous low around 0.00626.
If you have any technical analysis or a great trade you took with an explanation of your process, please send it to us via our Instagram here or email [email protected] or [email protected]. The trader who sends the best analysis/trade that week will receive a 25% discount code to use on any Evaluation.
