

Technical Analysis
Trend and Moving Averages:
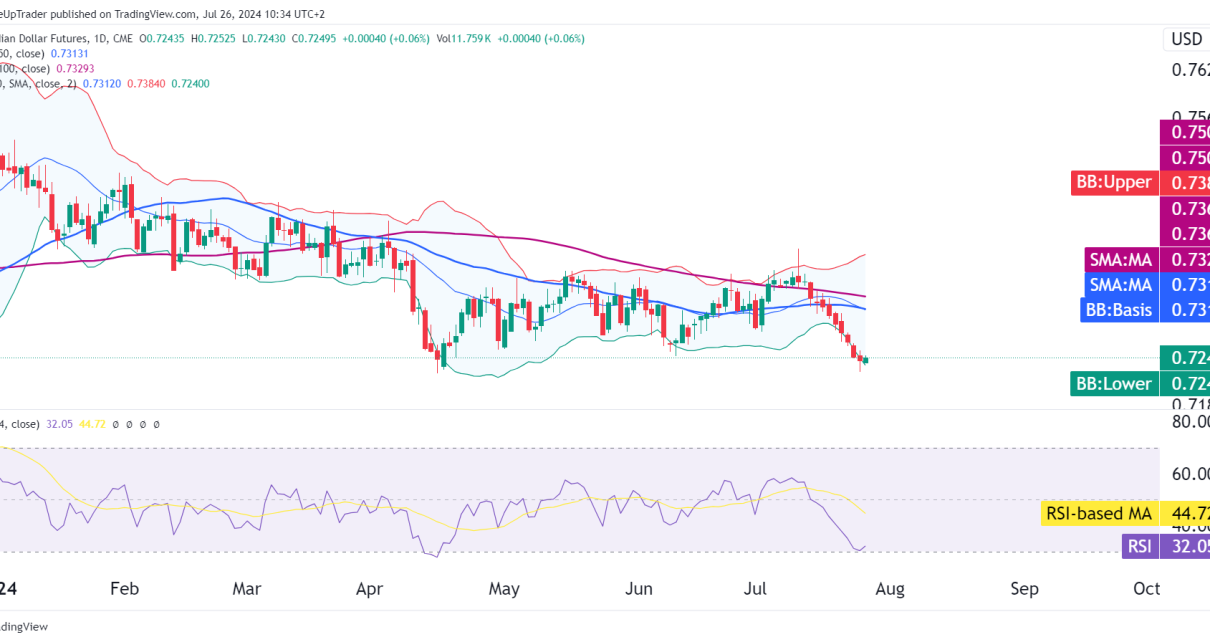
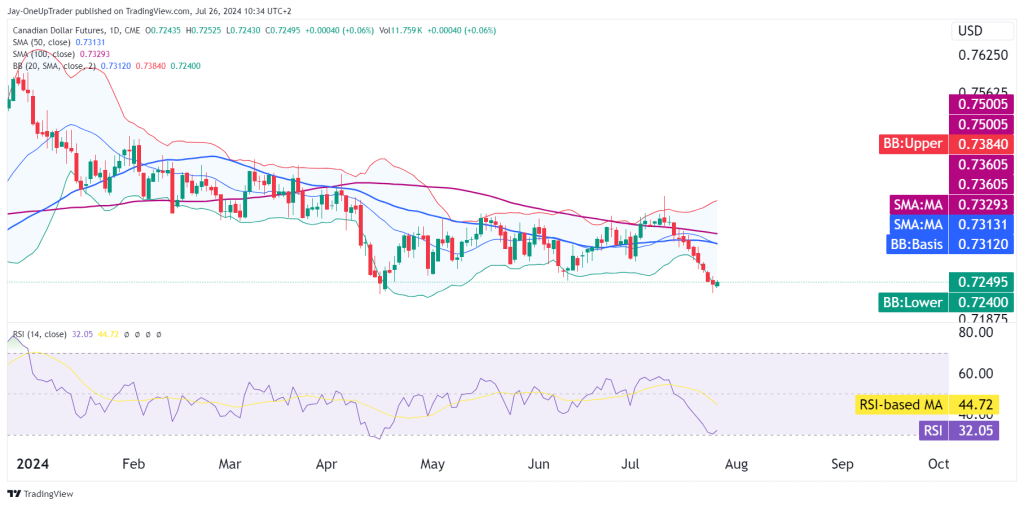
- The price is at the lower Bollinger Band ($0.72400), this shows us that price could be oversold at the moment especially since it coincides with a support zone.
- The bands are widening, too, but as long as the support holds at around 0.7249, then bullish positions should be safe.
The RSI is also at oversold territory adding further fuel to the possibility of a price pump from here.
Technical Patterns
Support and Resistance Levels:
- Support: Immediate support is at the lower Bollinger Band ($0.72400) and must hold in order for longs to be safe in the medium term.
- Resistance: The nearest resistance is at the 50-day SMA ($0.73131) and the 100-day SMA ($0.73293).
Trade Opportunities
Long Position
Given the RSI at oversold and the price at the lower Bollinger Band, a high-probability trade setup for a long position could be considered if a reversal signal comes.
- Entry: Consider entering a long position if the price shows signs of reversal, such as a bullish candlestick pattern (e.g., hammer or bullish engulfing) near the lower Bollinger Band ($0.72400).
- Target: The initial target for the long position could be the 50-day SMA at $0.73131, followed by the 100-day SMA at $0.73293 if the bullish momentum continues.
- Stop-Loss: Place a stop-loss below the recent low at around $0.72200 to manage risk.
If you have any technical analysis or a great trade you took with an explanation of your process, please send it to us via our Instagram here or email [email protected] or [email protected]. The trader who sends the best analysis/trade that week will receive a 25% discount code to use on any Evaluation.