

Recap from August 7
In the August 7th analysis, we noted that:
- ES was holding its uptrend but showed early signs of exhaustion after a strong summer rally.
- RSI was coming off overbought levels, suggesting the potential for either consolidation or a corrective dip.
- The 6,200–6,250 zone was flagged as a key support area, with upside still possible if buying interest remained strong.
Technical Analysis
Trend & Structure
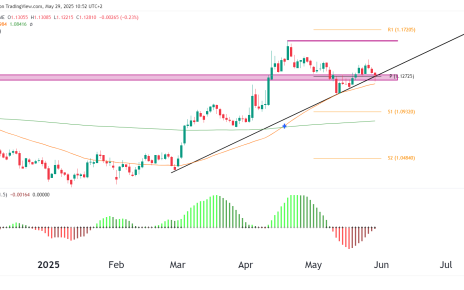
ES is still in a strong uptrend as bulls remain in control, with pullbacks being no more than a few percentage points. Currently, however, the buying pressure is stalling slightly, and there is a bearish divergence appearing on the RSI which means it might be the time for fresh buyers to wait it out until a solid confirmation of the trend continuation appears.
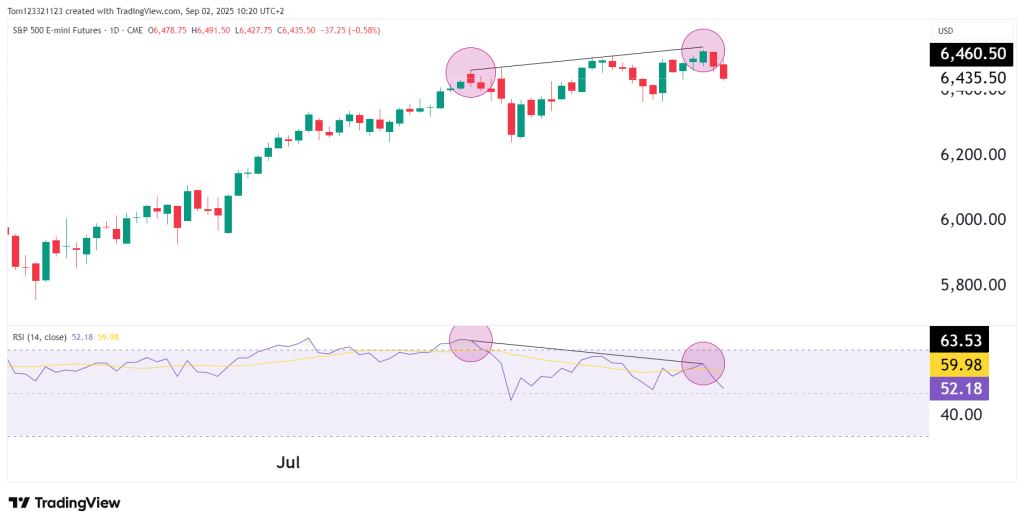
Momentum
- RSI has cooled from near 70 in July to the low 50’s now.
- This aligns with our earlier warning that the rally might stall or correct, and the market is indeed digesting gains.
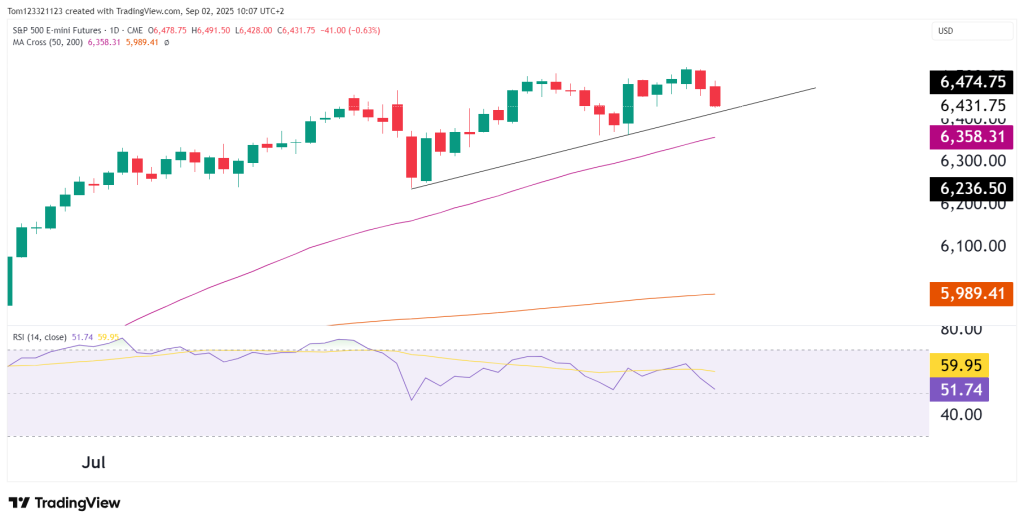
- The rising trendline support (~6,360–6,370) is being tested; this is a key level for bulls in September.
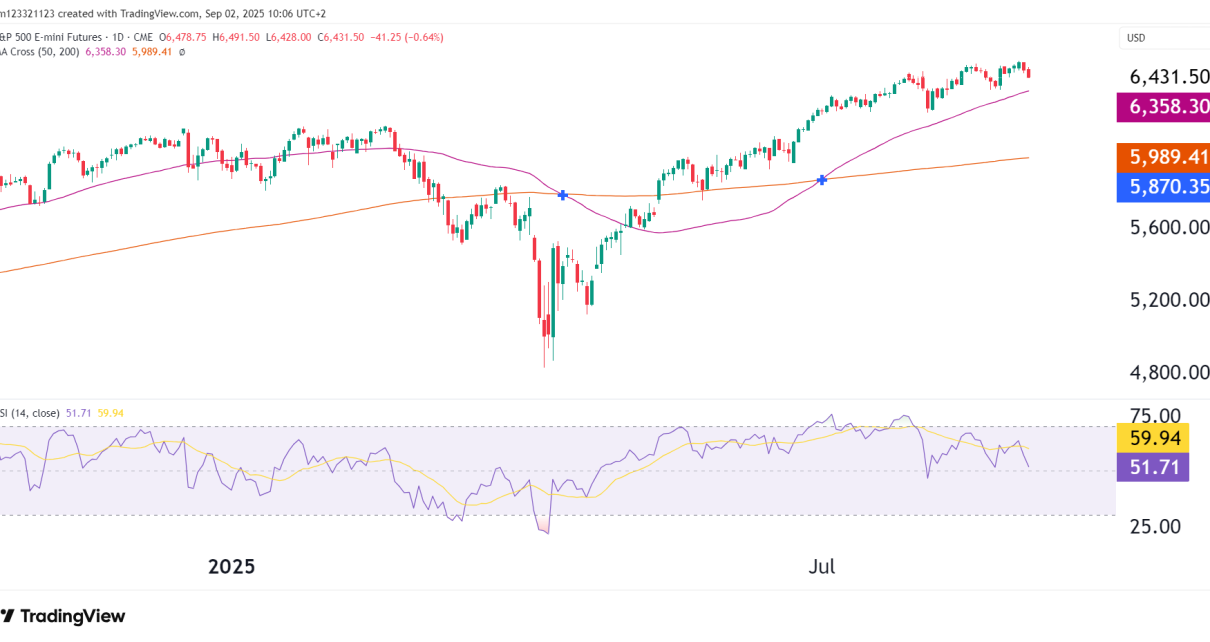
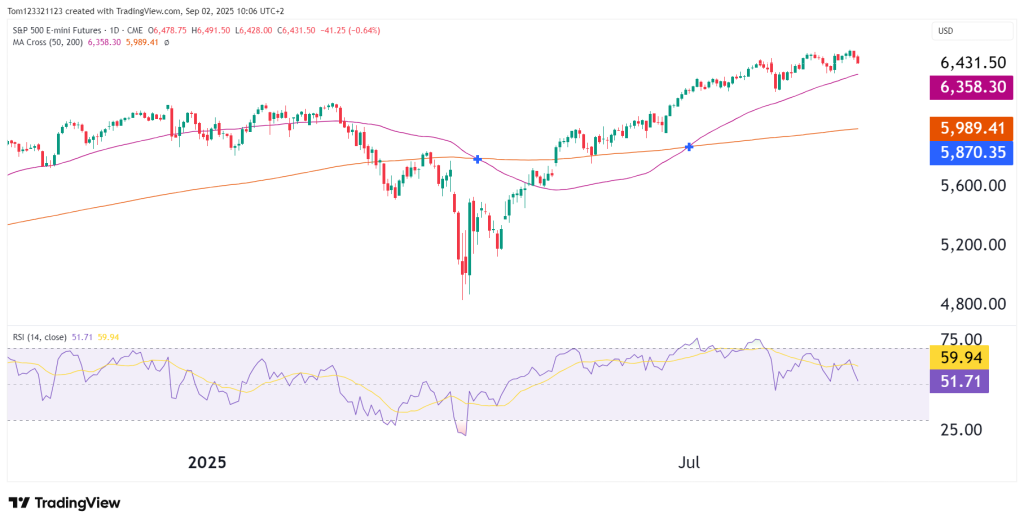
Moving Averages
Price is still above both the 50-day MA (6,358) and 200-day MA (5,989) → confirms the bullish medium-term bias. As long as price remains above the 50 moving average, we could say that bulls are still in control and there is no short-term panic.
Key Technical Levels
| Level | Type | Commentary |
|---|---|---|
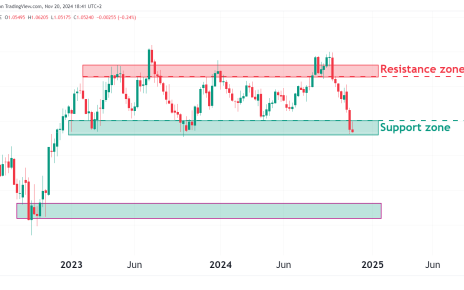
| 6,490–6,500 | Resistance | Recent high, strong resistance zone |
| 6,360–6,370 | Trendline Support | Current key zone |
| 6,236–6,250 | Secondary Support | Previous analysis zone, next line of defense |
| 5,989 | 200-day MA | Long-term bull/bear line |
Probability Table
| Scenario | Estimated Probability | Notes |
|---|---|---|
| Retest of 6,490–6,500 and breakout higher | 35% | Bulls still in control medium-term, but need fresh catalysts to push ATHs |
| Consolidation between 6,250–6,450 | 45% | Most likely near-term outcome as RSI neutral and trendline gets tested |
| Deeper pullback toward 6,200–6,250 | 20% | Would require trendline break and risk-off sentiment globally |
Trade Ideas
Bullish Swing
- Entry: On bounce confirmation from 6,360 support
- Target: 6,490–6,500 retest
- Stop: Below 6,300
Defensive Short
- Entry: If daily close below 6,358 (50-day MA)
- Target: 6,250, then 6,200
- Stop: Above 6,420
Ending Off
ES has followed the August 7th analysis almost exactly: momentum cooled, the rally stalled, and price is testing the rising support line. As long as 6,360–6,370 holds, the bias stays cautiously bullish. A break below, however, would validate the pullback scenario toward 6,200 flagged in our earlier analysis.