


Introduction
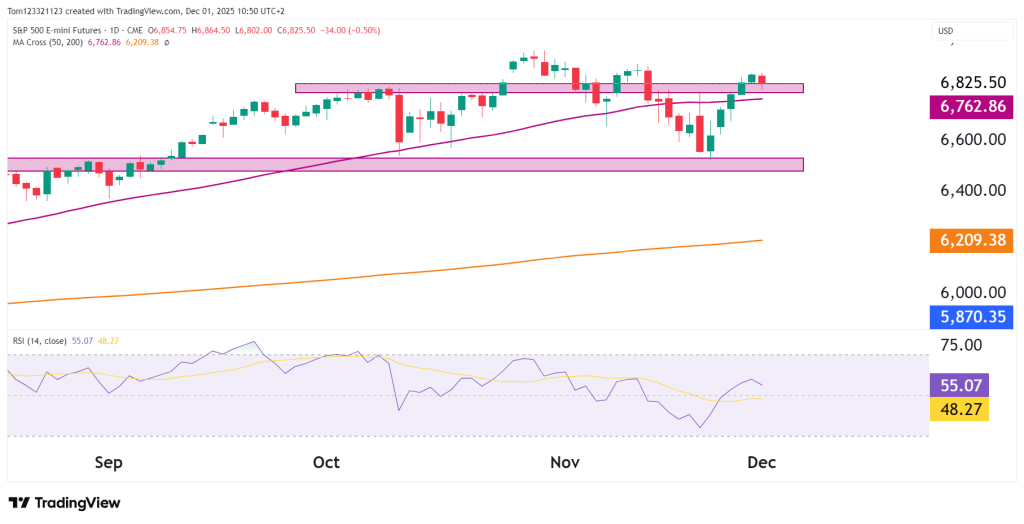
The S&P 500 E-mini Futures (ES) have found some bullish momentum now pushing close to the all-time high. Price has also broken above the 50-day moving average, a good sign that sentiment is shifting to bullish again. Buying power and risk appetite is increasing as the market is expecting no hikes for the next several meetings.
Let’s take a closer look at the technicals and what they are telling us.
Technical Overview
ES Daily Chart Technical Analysis
ES continues to trade in a wide range between 6,600 support and the 6,825–6,865 resistance band. Price rallied strongly last week, painting 5 green candles in a row as the risk appetite increased.
The recent push higher has now brought ES directly into resistance, marked by:
- The former support-turned-resistance zone (≈ 6,810–6,860)
- A horizontal ceiling tested multiple times since October
- A rising but flattening 50-day moving average at 6,762.86
If ES can close above 6,870, momentum would likely carry toward the upper extension targets near 6,925 and potentially 7,000.
However, failure to break the ceiling may lead to another pullback toward:
- 6,740–6,760 — short-term support.
- 6,650–6,600 — major support and the bottom of the November range.
- 6,209 (200-day MA) — a deeper corrective target if sentiment deteriorates.
The RSI at 55.07 shows improving bullish momentum but is not yet in overbought territory.
Key Technical Levels
| Type | Level | Description |
|---|---|---|
| Resistance 1 | 6,825–6,865 | Multi-week ceiling. |
| Resistance 2 | 6,925 | Extension target if breakout holds. |
| Resistance 3 | 7,000 | Psychological level. |
| Support 1 | 6,740–6,760 | First pullback zone. |
| Support 2 | 6,600–6,640 | Major support. |
| Support 3 | 6,209 | 200-day MA. |
Probability Table (Next 2–3 Weeks)
| Scenario | Estimated Probability | Notes |
|---|---|---|
| Breakout above 6,865 → target 6,925–7,000 | 45% | Strong recent bounce, but overhead resistance remains heavy. |
| Consolidation between 6,600–6,860 | 40% | Range has held for weeks; likely if bulls fail to force a breakout. |
| Pullback toward 6,600 support | 15% | Requires renewed selling pressure or weak macro catalysts. |
Fundamentals
Recent U.S. economic data continues to support the idea of a soft landing, which has helped stocks steady. Inflation has cooled for the third month in a row. The labor market is still strong but is finally showing signs of easing, which is what the Fed has been aiming for. Treasury yields have slipped a bit, taking some pressure off equities.
Markets now expect the Fed to hold rates steady for the next several meetings, which is keeping investors comfortable with taking on more risk. Even so, there are still uncertainties around upcoming manufacturing data and ongoing geopolitical tensions. These could weigh on sentiment in the short term, especially if ES cannot break through resistance.
🎯 Ready To Get Funded?
Start your 7-day free $100K evaluation with OneUp Trader and take the first step toward becoming a funded trader.
Start Evaluation Now →Summary
ES futures have rallied and come close to the all-time highs. Short-term momentum looks better, but buyers still need a clear breakout to unlock the next move higher toward 6,925 to 7,000. Until that happens, ES can slip back into choppy, sideways trading or fall toward 6,740 to 6,760 and possibly 6,600. The bulls have stabilized the market, but the breakout is not confirmed yet.
This analysis is for educational and informational purposes only and does not constitute trading advice or a recommendation to buy or sell any futures contracts. Futures trading involves significant risk and may not be suitable for all investors. Always conduct your own research and consult with a licensed financial professional before making trading decisions.


