

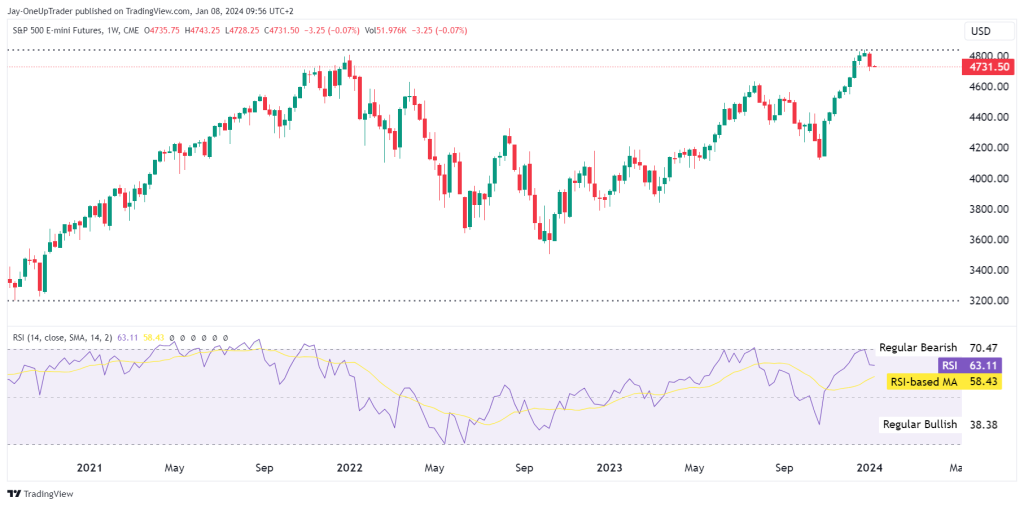
Starting with the weekly chart, the Relative Strength Index (RSI) is hovering around 63.11, which is above the midline but below the overbought threshold of 70. This suggests that while the market has bullish momentum, it is not yet in extreme territory where we might expect a pullback. The RSI-based Moving Average (MA) is slightly lower at 58.43, indicating a solid uptrend. If we see the RSI break above 70, we could anticipate a short-term reversal or consolidation if the market price accelerates quickly, forming a pole. If the market trends slowly into overbought territory, then the signal would be less valid.
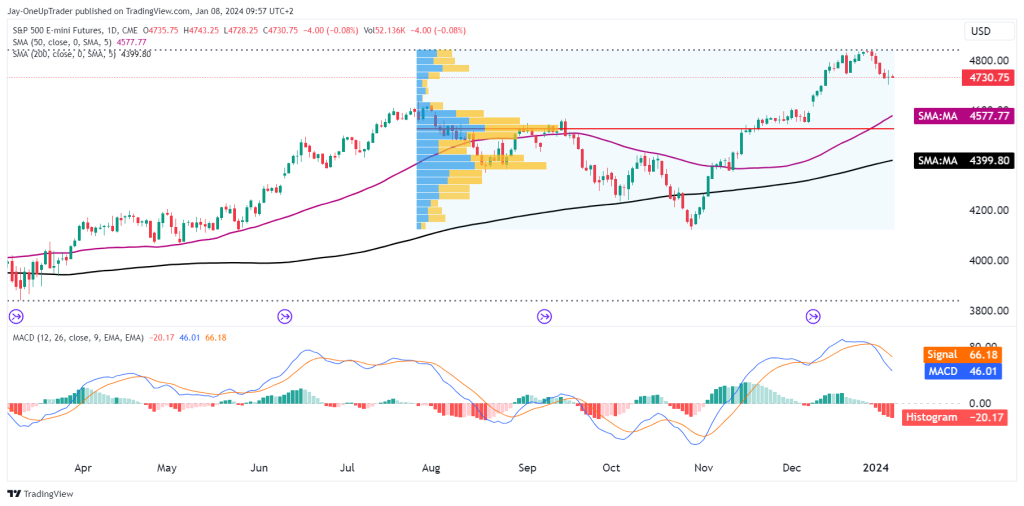
Moving to the daily timeframe, the S&P 500 is trading above both the 50-day Simple Moving Average (SMA) at 4577.77 and the 200-day SMA at 4399.80. These levels are critical support zones. Should the market pull back, we’d look for the 50-day SMA to hold; a break below could signal a shift to a more bearish stance, and we might consider short positions with a target near the 200-day SMA.
The Moving Average Convergence Divergence (MACD) on the daily chart shows a recent crossover of the signal line, with the MACD line at 46.01 and the signal line at 66.18. The negative histogram value (-20.17) suggests the momentum is waning. If the MACD line crosses below the signal line with a candlestick confirmation, we could initiate a short position, using the crossover as a trigger for entry.
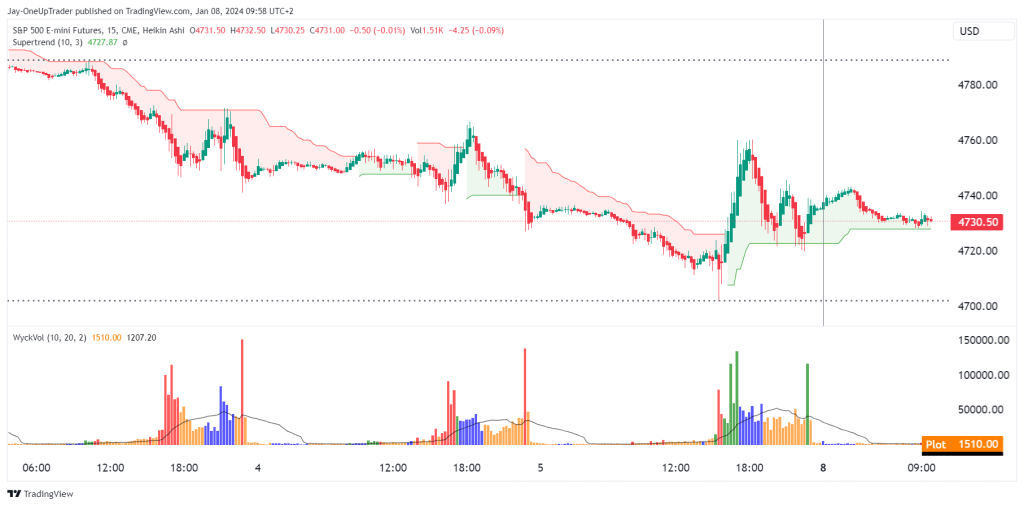
On the 15-minute chart utilizing the Heikin Ashi candles and the Supertrend indicator, we see a mixed signal. The Heikin Ashi shows a sideways trend, with the price consolidating around 4730.50. The Supertrend indicator has not yet flipped to a clear bullish or bearish signal which means we would need to wait for a decisive break or pre-empt it and enter now. A break above the Supertrend line might offer a long position opportunity, while a break below could validate a short position, aiming for subsequent support levels.
Our analysis suggests that while the market is currently in an uptrend, there are signs of potential weakness on the horizon. We could take advantage of this by setting up trades that anticipate both continuation and reversal. Long positions might be favored above the 50-day SMA and the Supertrend line on the 15-minute chart, with tight stops to manage risk. Short positions could be considered on a break below these levels, targeting the 200-day SMA or the next significant volume node on the profile. As always, maintain discipline with stop-loss orders to protect against unexpected market movements.
