


Introduction
S&P 500 E-mini futures have pulled back from the 7,000 area after multiple tests of resistance. This was the formation of the ATH too, and now the price appears to be in a range between 6,800 and 7,000.
There is some profit-taking happening which is why ES is no longer forming higher highs and higher lows but the question is whether this will act as a spring for further upside or lead to a bigger pullback.
The bigger trend is still bullish, though, but in the short term, ES is no longer in clean breakout mode.
Let’s take a closer look at the technical structure.
Market Structure & Trend
Daily Chart

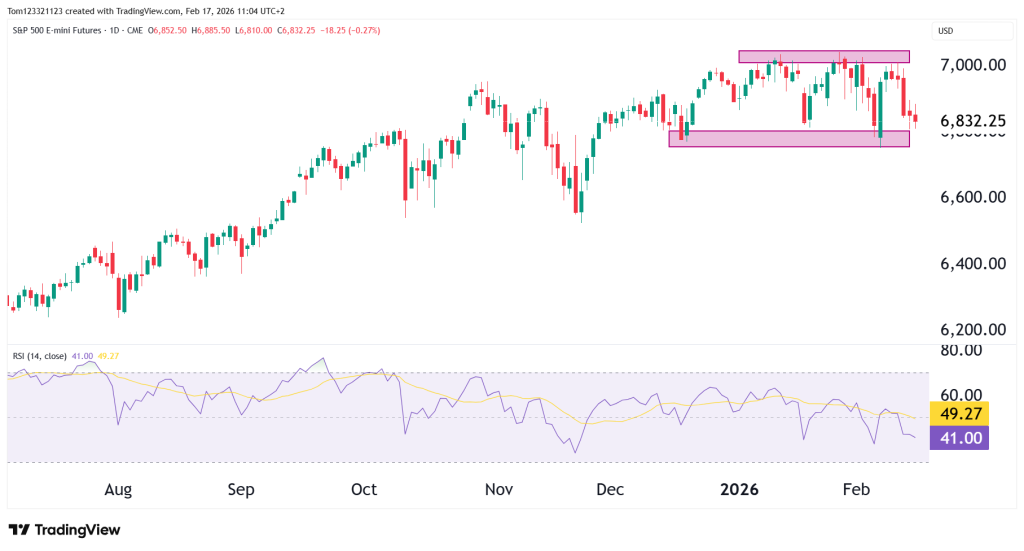
The daily chart shows that ES pushed into the 7,000–7,050 zone several times but failed to sustain above that. That area has now clearly defined itself as near-term resistance.
At the same time:
- The 6,780–6,820 zone has acted as support
- Price is currently pressing back toward that lower range
- RSI has slipped toward 41–45, reflecting fading short-term momentum
This creates a visible range structure:
Resistance: ~7,000–7,050
Support: ~6,780–6,820
Momentum has shifted from expansion to compression. RSI is no longer holding above 50 consistently, which suggests buyers are losing control.
Key Technical Levels
Resistance
7,000–7,050:
Recent highs and repeated rejection zone. A clean daily close above 7,050 would invalidate the range and likely trigger continuation toward 7,200+.
In price discovery environments, round numbers like 7,000 often act as psychological magnets before a breakout.
Support
6,780–6,820:
Lower boundary of the recent range. A break below this zone would open downside.
6,600–6,650:
Prior structure from late December consolidation.
6,400–6,450:
Deeper structural support if selling accelerates.
As long as ES holds above 6,780, this remains a consolidation, not a reversal.
Looking Forward
Bullish Continuation
Acceptance above 7,050 reopens upside momentum, targeting 7,200 and potentially higher if trend strength returns.
Sideways Consolidation
Price continues rotating between 6,800 and 7,000 while momentum resets. This would allow RSI to rebuild without damaging the broader uptrend.
Corrective Pullback
A breakdown below 6,780 could trigger a retracement toward 6,600 or lower. This would still qualify as a correction inside the larger bullish structure unless the 200-day average is threatened.
Estimated Probability Table
| Scenario | Description | Estimated Probability |
|---|---|---|
| Bullish continuation | Break and hold above 7,050 | 40% |
| Sideways consolidation | Range between 6,800–7,000 | 35% |
| Corrective pullback | Break below 6,780 toward 6,600 | 25% |
Fundamentals to Watch
Several fundamentals could influence ES in the near term:
1. Treasury Yields
If yields rise sharply, equity multiples may compress, pressuring ES. Stable or easing yields would support a breakout attempt.
2. Federal Reserve Communication
Any shift in tone around rate cuts or liquidity conditions can quickly impact equity momentum.
3. Inflation Data (CPI / PCE)
Stronger-than-expected inflation could weigh on equities via rate expectations.
Final Takeaway
The broader structure remains bullish, but short-term momentum has weakened, and the market is now testing support rather than expanding higher.
Either:
- Buyers reclaim 7,050 and resume the trend,
- Sellers break 6,780 and trigger a deeper corrective phase.
- Consolidation continues the way it is.
This analysis is for educational and informational purposes only and does not constitute trading advice or a recommendation to buy or sell any futures contracts. Futures trading involves significant risk and may not be suitable for all investors. Always conduct your own research and consult with a licensed financial professional before making trading decisions.
