


Introduction
The S&P 500 E-mini futures continue to grind higher, pressing into the all-time high resistance zone just below 7,000. Price is holding here after dropping below the 50 moving average and immediately bouncing back with a bullish engulfing candlestick pattern.
Buyers are still in control, but upside momentum is slowing as prices stretch and profit-taking begins. As mentioned, though, the bulls are still in firm control, and there is no sign of a reversal as long as price remains pressing against the ATH and above the 50-day moving average.
Market Summary
Primary trend: Strongly bullish on higher timeframes
Current market perspective: Late-stage uptrend with consolidation near highs
Key support: 6,800–6,850
Bias-defining level: 6,950–7,000
Risk to the thesis: Sustained acceptance below rising trend support
The market has already dealt with higher interest rates, slower growth expectations, and several macro scares, yet prices are still holding near highs.
At the same time, the S&P 500 is trading close to upside targets based on the 2022–2023 base. That means further gains likely need either a new catalyst or a period of sideways action to cool things off.
This makes the current area important. What matters most now is whether buyers can keep supporting small pullbacks, not how far prices can jump in the short term.
Market Structure & Trend
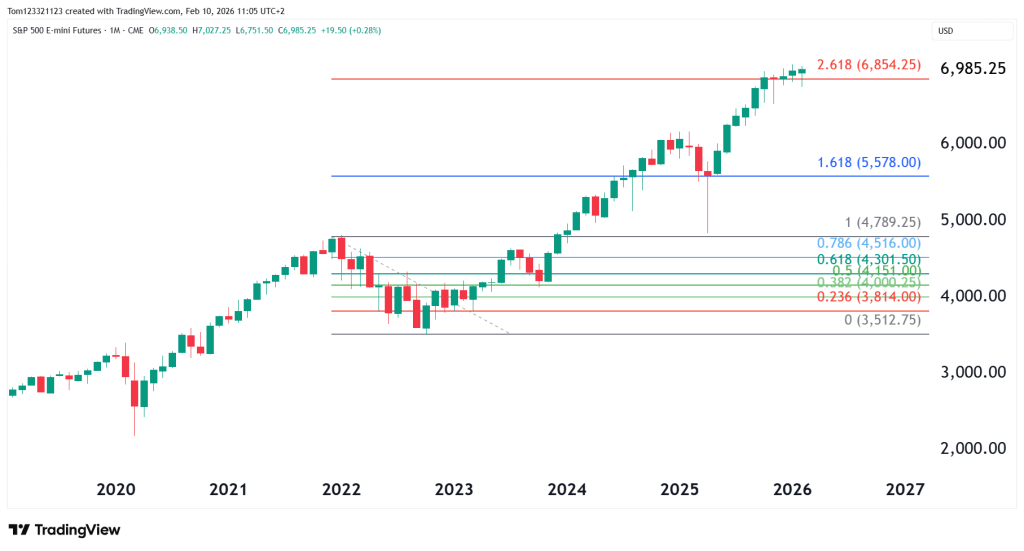
Monthly Chart
On the monthly chart, ES has completed a clean recovery from the 2022–2023 drawdown and is now trading near the 2.618 Fibonacci extension of that base, around the 6,950–7,000 area.
- Long-term trend remains firmly bullish
- Price is extended but not parabolic
- Pullbacks since 2023 have been controlled and corrective
Daily Chart
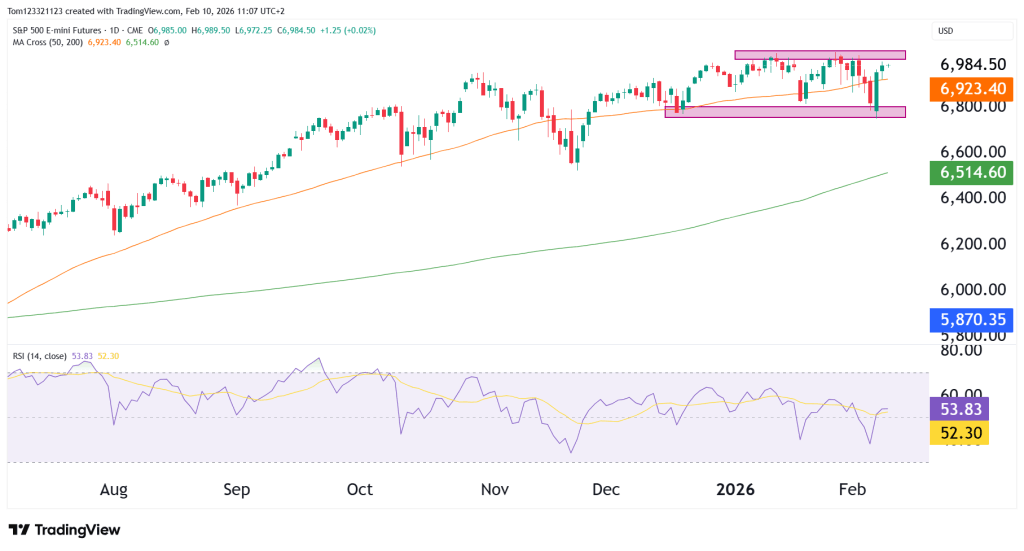
On the daily chart, ES is moving sideways just below resistance after repeatedly holding support near the rising 50-day moving average.
Key points:
• Higher lows are still in place
• Buyers keep showing up on dips
• The 6,950–7,000 area is being tested, not strongly sold
A recent drop to the lower end of the short-term range quickly attracted buyers, showing demand is still present below current prices.
As long as pullbacks remain small, the overall trend stays healthy.
Looking Forward: Scenarios
Bullish Continuation (40%)
Price remaining above 7,000 leads to slow, grinding upside toward higher extension targets.
Sideways Consolidation (40%)
Price chops between 6,850 and 7,000 as momentum resets without damaging the trend.
Corrective Pullback (20%)
A break below 6,800 opens room for a deeper retracement while keeping the longer-term bull market intact.
Final Takeaway
The trend remains strong, but prices are stretched enough that what matters now is whether buyers can hold pullbacks, not how quickly new highs appear. Trading sideways near highs isn’t a sign of weakness. It’s how strong trends pause and reset.
Above 6,850, buyers are still clearly in control. Below that level, the market moves from pausing to correcting.
This analysis is for educational and informational purposes only and does not constitute trading advice or a recommendation to buy or sell any futures contracts. Futures trading involves significant risk and may not be suitable for all investors.