


Introduction
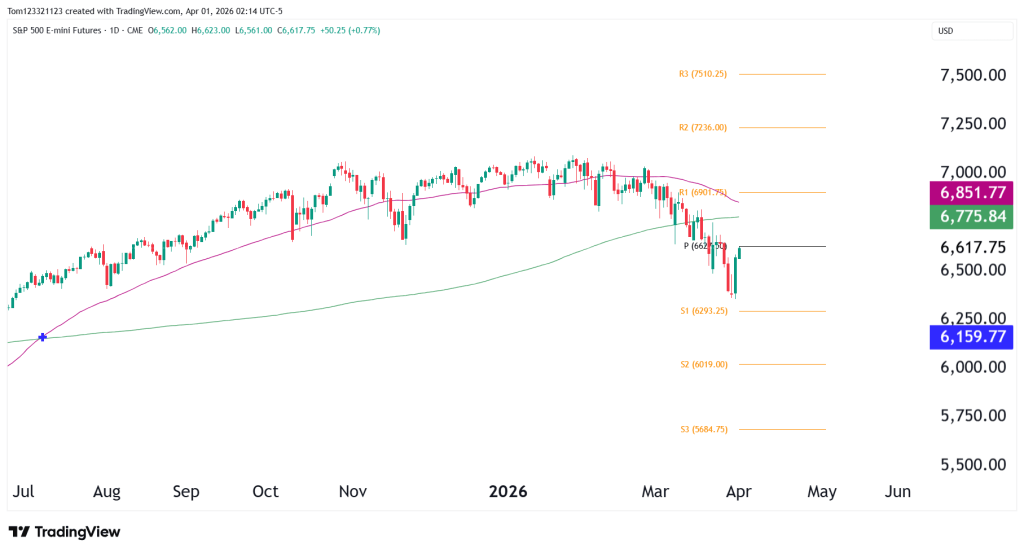
ES has bounced after prices have been declining since the start of the war in the Middle East 4 weeks ago, but the overall structure has not improved yet. The move down broke important support levels and pushed price below the 200-day moving average, which shifts the short-term trend to bearish.
Right now, price is moving back into the area between 6,600 and 6,770. If the market is still strong, it should be able to reclaim this area and hold above it. If not, this is where sellers could step back in.
The way price is moving also matters. The bounce has been sharp but not very stable. There’s no clear trend, just fast moves in both directions. This is normal as price discovery occurs because of major developments in the world.
On the downside, 6,300–6,350 remains the key support. That level held once. If price goes back there again, it becomes weaker. A break below it would likely open the door toward 6,150.
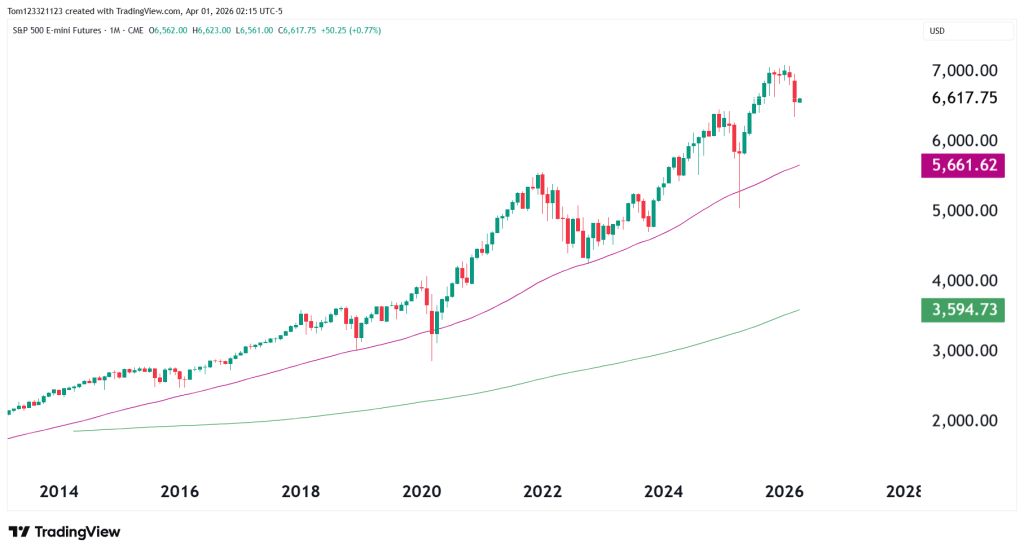
Looking at the longer term trend, it is still up, but momentum has clearly slowed. Looking at the monthly chart below, the recent move looks like a very small pullback that has lasted only one month. The reasoning behind the pullback is what is important because it is not just a simple technical pullback, it is due to the war. This is what makes it more unpredictable and volatile. The strength in the US Dollar is also undoubtedly playing a role in this because the US equities are priced in dollars, meaning the stronger the dollar, the weaker the equities should perform.
Probability Table
| Scenario | Description | Estimated Probability |
|---|---|---|
| Lower High | Rejection below 6,770 → move back toward 6,300 | 50% |
| Range | Price trades between 6,300–6,700 | 30% |
| Recovery | Reclaim of 6,770 → continuation higher | 20% |
Possible Trades
The focus here should be on reaction at levels, not chasing price.
A short setup becomes more interesting if price pushes into the 6,700–6,770 resistance zone and starts to stall. That would align with the idea of a lower high forming. In that case, traders would look for downside back toward 6,500 and potentially 6,300, while managing risk above the highs.
On the long side, it’s less attractive unless the market shows strength. That would mean a clean move above 6,770 and holding above it. If that happens, dips could be bought with the idea that the breakdown has failed. Also, with this, there needs to be some positive developments in the Middle East for this to be a possibility.
This analysis is for educational and informational purposes only and does not constitute trading advice. Futures and forex trading involve significant risk and may not be suitable for all investors. Always conduct your own research before making trading decisions.