


Introduction
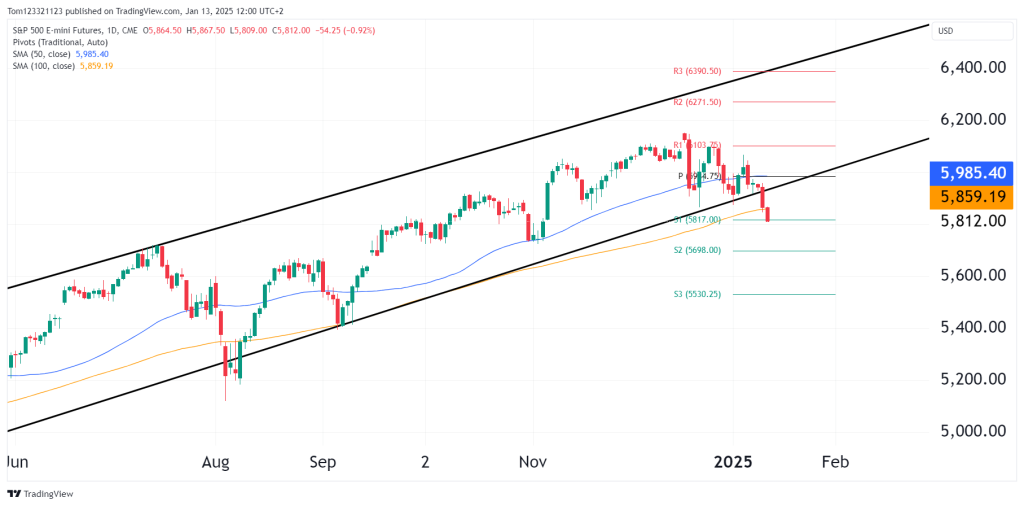
Since our last analysis on January 6, 2025, the S&P 500 E-mini Futures (ES) have broken below a key technical support, bringing with it a small panic sell-off. The price is currently trading near 5,812, marking a break below the bullish ascending channel that has defined the market’s structure since mid-2024. This breakdown warrants a reevaluation of the short-term and medium-term outlook.
Technical analysis
Break Below Ascending Channel:
- The ES has decisively broken below the lower boundary of the ascending channel, invalidating the prior bullish structure unless the price returns back to the channel soon.
- The channel breakdown suggests a potential transition to a correction phase.
Loss of the 50-day SMA:
- Price has fallen below the 50-day SMA (5,985), which had previously acted as dynamic support.
- The 100-day SMA (5,859), now in focus, is also being tested as potential support. A move below this could accelerate selling.
Pivot Levels Tested:
- The price has sliced through the S1 support pivot (5,817) and is now hovering just above it.
- If this level fails, the next downside target aligns with S2 support at 5,698.
Support and Resistance Levels
Support Levels:
- S1 (5,817): Currently acting as immediate support but is under heavy pressure.
- S2 (5,698): The next significant support level, aligning with prior consolidation zones from October 2024.
- 5,530 (S3): A deeper correction could test this level, which represents major support near the psychological 5,500 mark.
Resistance Levels:
- 5,985 (50-day SMA): Now a key resistance level; regaining this level would be necessary to restore bullish momentum.
- Pivot Level (5,947): Previously support, this level now acts as resistance.
- 6,103 (R1): A breach above this level is required for a return to the upper half of the prior trading range.
Bullish and Bearish Scenarios
Bullish Case:
- A strong bounce from the 100-day SMA (5,859) or S1 pivot (5,817) could trigger a recovery back toward the 50-day SMA (5,985).
- Regaining 5,985 would shift the narrative back to bullish, with the next target at 6,103 (R1).
Bearish Case:
- A sustained break below the S1 pivot (5,817) would expose the ES to further downside toward S2 (5,698).
- Failure to hold 5,698 could see an accelerated drop toward the S3 pivot (5,530) and the psychological 5,500 level.
Trade Ideas
Bearish Setup:
- Entry: Short positions on a confirmed break below 5,817.
- Targets:
- First target: 5,698 (S2).
- Second target: 5,530 (S3).
- Stop-Loss: Above 5,900 to minimize risk.
Bullish Setup:
- Entry: Long positions on a bounce near 5,859 (100-day SMA) or 5,817 (S1).
- Targets:
- First target: 5,985 (50-day SMA).
- Second target: 6,103 (R1).
- Stop-Loss: Below 5,800 to limit downside risk.
