

Current Overview and Market Sentiment:
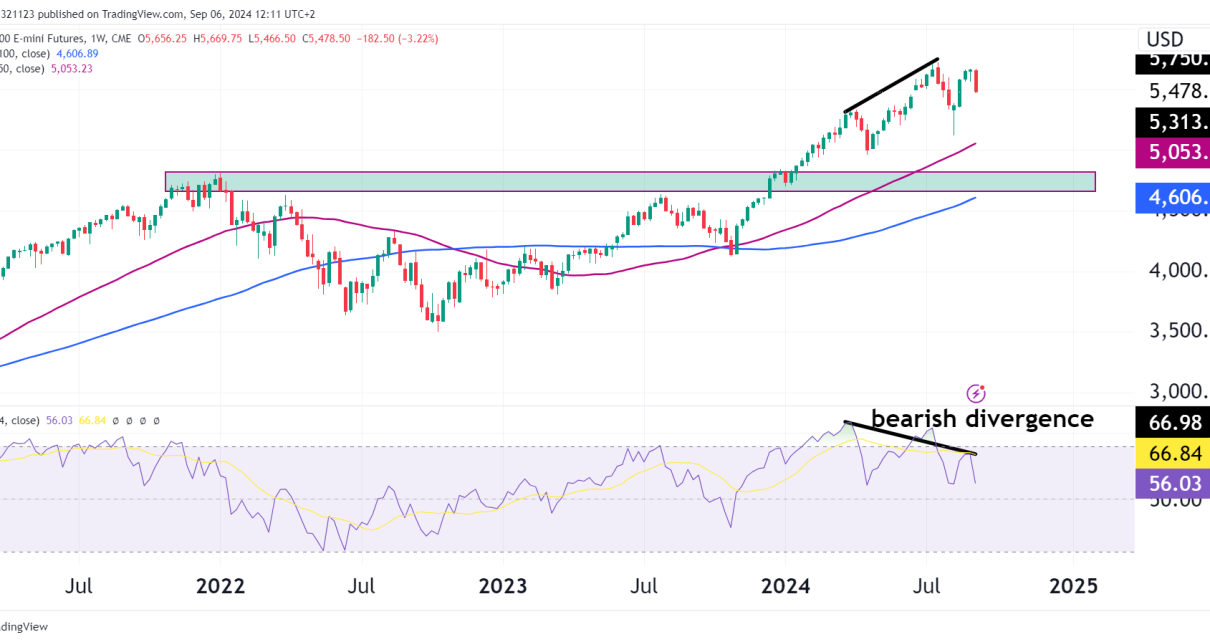
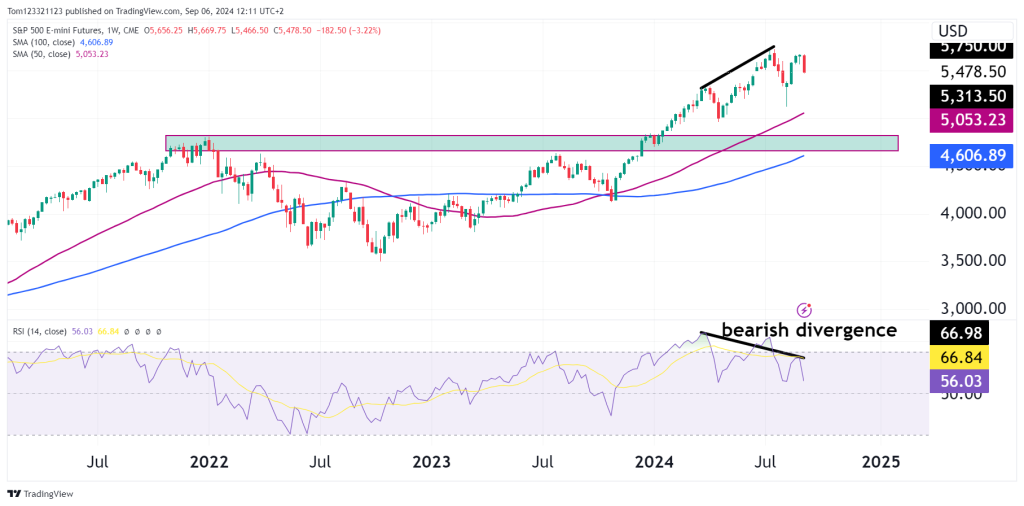
The S&P 500 futures chart is showing signs of exhaustion after an impressive rally over the past two years. As we approach September 2024, the market is showing clear indications of bearish divergence, warning us of a possible trend reversal or significant correction in the coming weeks.
Price Action: The S&P 500 futures are currently trading at $5,478.50, down 3.22% for the week. The recent high of $5,750.00 was reached earlier in 2024, but the market has been struggling to maintain that momentum. This decline comes after an extended run that started in late 2022, when prices bounced off the long-term support near $3,500.
RSI (Relative Strength Index): The RSI is currently at 56.03, coming down from a high of 66.98 in earlier months. Notably, there is a bearish divergence between the price and RSI.
Technical Analysis
Bearish Divergence on the RSI: As mentioned, this divergence is key. When price action makes higher highs while the RSI makes lower highs, it tells us that the bullish momentum is weakening despite rising prices. This pattern is often followed by corrective moves or a more substantial downturn, making it critical for us to monitor closely. If we see the RSI dip below the 50 line, it means the divergence has been confirmed and we could see ES move sideways for a while or even lower.
Support Zone at $4,600 to $5,000: The green-shaded area on the chart represents a key support level, previously a strong resistance area in 2021–2022. A pullback to this zone would still be considered a healthy correction within a broader bull market unless it breaks below the 100-week SMA, in which case the structure could turn significantly bearish.
Recent Rejection Near $5,750: The market rejected just below $5,750, forming a potential double top pattern in the short term. Although this pattern has not yet confirmed (as we would need a break below the previous low to confirm), it adds to the cautionary signals accumulating on the chart.
Short-Term Outlook:
In the short term, the bearish divergence suggests a correction is likely. The immediate downside target would be the 50-week SMA around $5,050. If the market breaks below this level, the $4,600 to $5,000 zone would be the next key area to watch. However, traders should remain cautious, as the long-term uptrend could still attract buyers in this demand zone.
A failure to hold the 50-week SMA could lead to increased volatility, as more traders may begin taking profits or entering short positions.
Medium-Term Outlook:
In the medium term, the key is whether the market can hold above the 50-week SMA and the crucial $4,600 support area. If this support holds, we may see another attempt to break above $5,750. However, given the bearish divergence on the RSI, a retest of the 100-week SMA ($4,606.89) seems likely over the coming months.
If the price falls below the 100-week SMA, it would signal a significant shift in market sentiment, potentially leading to a deeper correction toward $4,000 or even $3,500 levels.
Long-Term Outlook:
Despite the current bearish signals, the long-term trend remains bullish as long as the price remains above the 100-week SMA. Long-term investors may look to accumulate positions on dips into the $4,600–$5,000 support zone, especially if the market shows signs of stabilization in that area. However, if we see a weekly close below $4,600, it could indicate the start of a more prolonged bear market phase.
Conclusion: Trade Setup
- Bull Case (Short to Medium Term): If the price finds support at the 50-week SMA ($5,053), we could see a bounce back toward the recent highs of $5,750. However, traders should be cautious given the bearish divergence on the RSI and consider taking profits near resistance.
- Bear Case (Short to Medium Term): A break below $5,053 would likely lead to further declines, with the next target being the $4,600 to $5,000 support zone. Should this area fail to hold, the 100-week SMA around $4,606 becomes critical. A breakdown below the 100-SMA would open the door to a much deeper correction.