Introduction
What if you are long stocks and the price only went up? What if the RSI was overbought ALL THE TIME? Would you think its time for a retracement? No, you wouldn’t because euphoria is striking, and that is dangerous. It is even difficult to do technical analysis because the price only goes up so how do we trade it? We can buy at the start of every session?
I want to know why this market goes up so hard all the time in an environment that doesn’t warrant it at all. The US stock market is going up only in hopes of what could happen, which is fine because that’s how markets function, but this time, I think it’s too far.
Becareful out there traders, a black swan event could come and cause markets to tank hard. Long-term investors should watch closely.
Technical Analysis
Weekly Chart
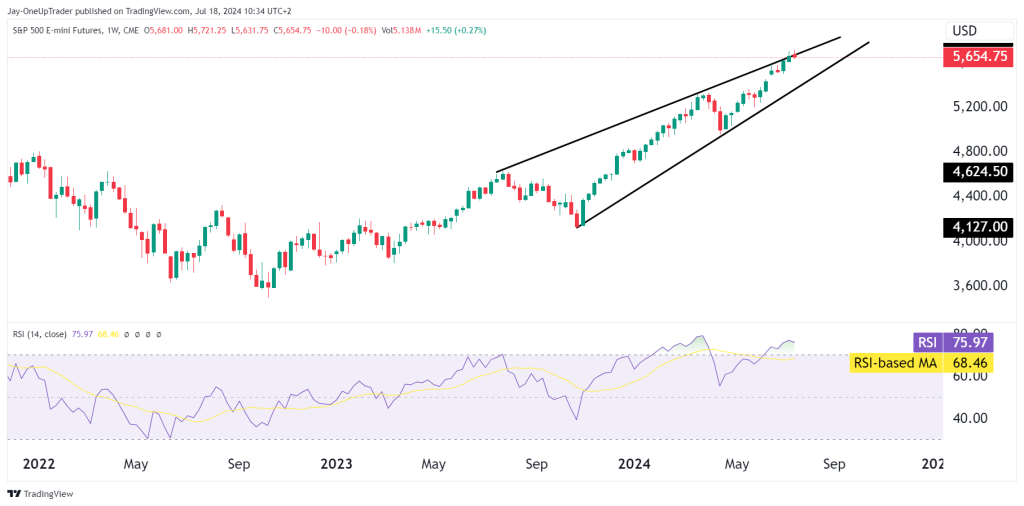
Traders, the price action is squeezing and forming a rising wedge pattern. Once price breaks below the low end of a rising wedge, we usually see sideways action for sometime or even a full retracement back to the start of the rising wedge pattern. Watch the lower level closely for a break below.
Also the RSI is overbought again but there is no bearish divergence. At the moment, it feels like the market is on leverage because of the hopes of a Trump presidency and An interest rate cut from the FED in September. If for some reason those catalysts do not occur we would likely see a lot of volatility as the market re prices itself.
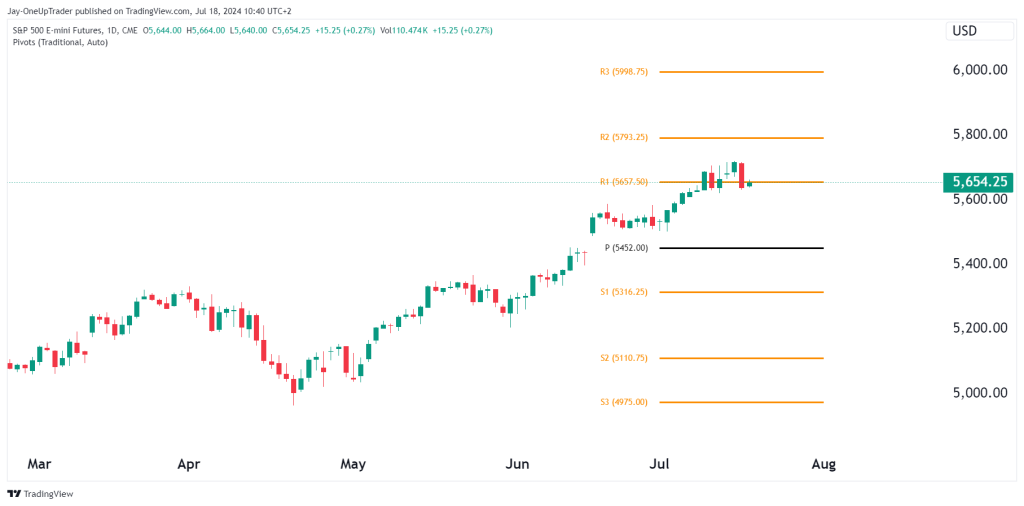
Daily Chart Trades
A high probability trade here is the one where we short with a stop above the recent high ($5,725) with a target at the pivot point $5,452.