

Overview and Market Sentiment:
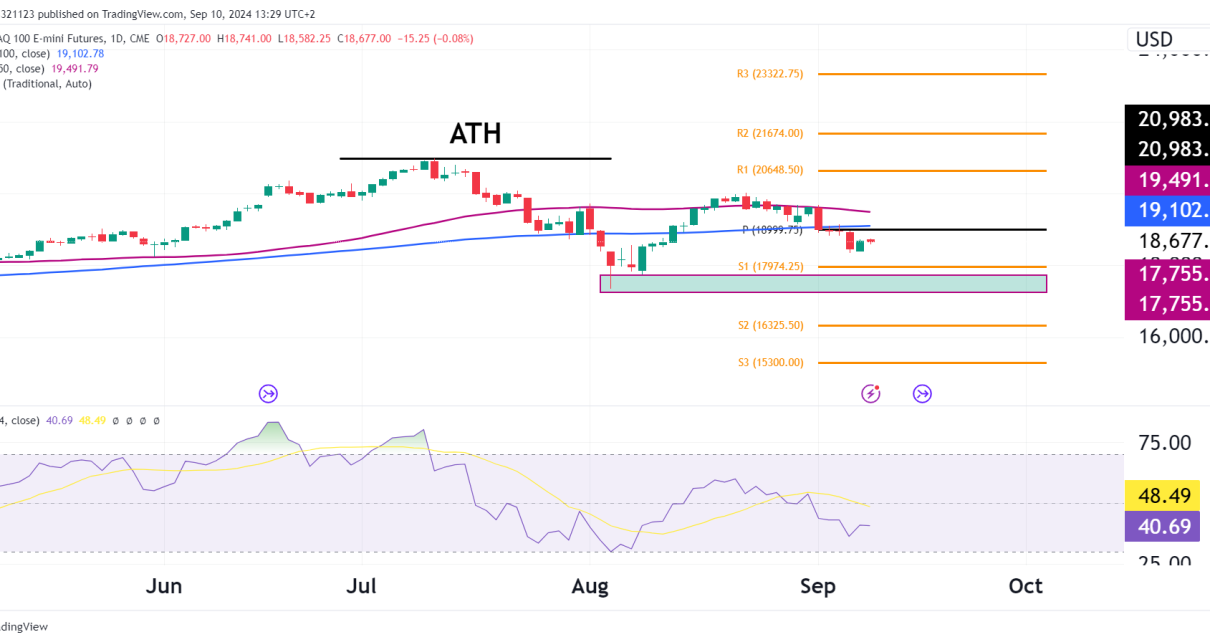
The NASDAQ 100 futures (NQ) have been in a strong long-term uptrend, gaining 22% for one year, but the recent pullback is raising caution among traders. The daily chart shows a technical retracement after reaching an All-Time High (ATH) earlier in the summer, and now the price is testing key support levels. Given the long-term bullish trend, this pullback could provide a buying opportunity.

Technical Analysis:
All-Time High (ATH) Rejection:
- After reaching its ATH of $21,000, the NASDAQ 100 has faced consistent selling pressure, leading to this multi-week pullback. This rejection has contributed to a short-term bearish sentiment but could also set up for a buy-the-dip opportunity if support holds.
Key Support Zone at $17,755 to $17,974:
- There is a strong support zone between $17,755 and $17,974 (S1 level). A break below this area could trigger a more extended move toward S2 at 16,325.50, but if it holds, it would likely provide a launching pad for a rebound.
- Historically, NASDAQ pullbacks of this magnitude have been followed by strong buying interest, so traders should watch for any reversal signals in this zone.
Conclusion: Trade Setup
- Bull Case (Short to Medium Term): If the price holds the key support zone at $17,755 to $17,974, there is a strong case for a bounce back toward $19,000 or higher, with a retest of the 50-day SMA at $19,491.79. Long positions could be taken in this support area, with stops just below $17,755. The risk-reward favors this strategy given the proximity to oversold conditions.
- Bear Case (Short to Medium Term): If NASDAQ breaks below the $17,755 support zone, it could trigger a larger correction, with downside targets at S2 ($16,325.50). A breakdown would invalidate the bull case and potentially lead to more selling pressure.
Given the long-term uptrend and the 22% year-to-date gain, the correction appears to be a normal pullback rather than a trend reversal. However, traders should keep a close eye on the support zone, as its break could lead to increased volatility. Tight risk management is crucial, and opportunities for both short-term bounces and deeper corrections exist depending on how the price interacts with current levels.