


Overview and Market Sentiment:
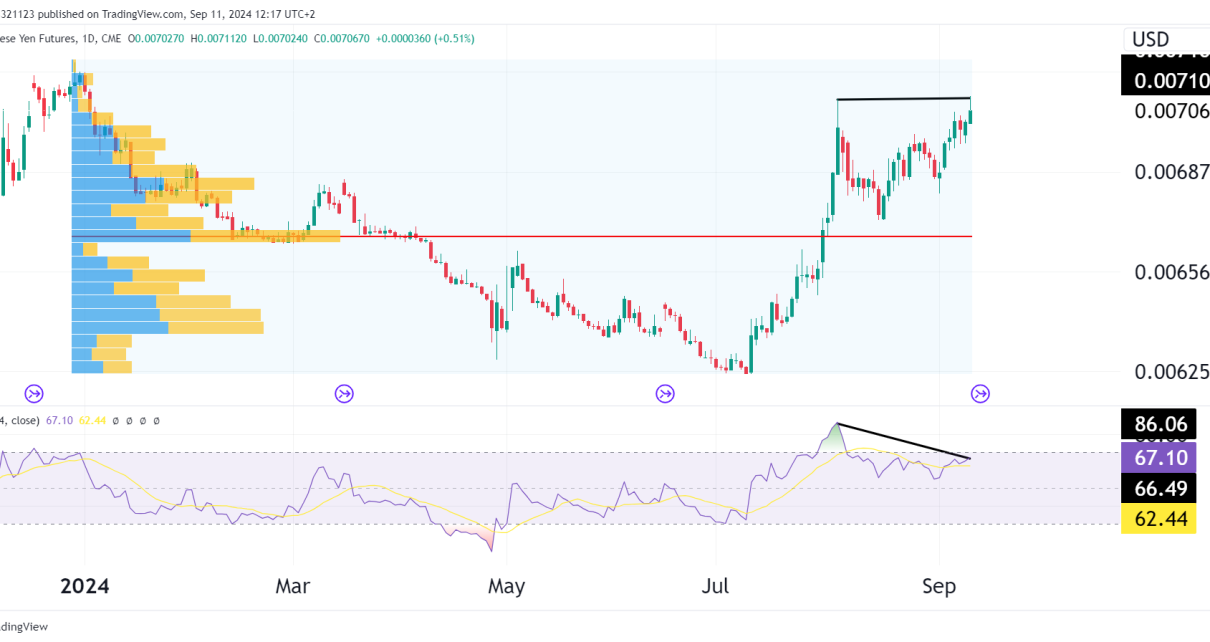
Japanese Yen futures have been in a strong upward move since June 2024, but there are signs of potential exhaustion, with the formation of a double top near the 0.0071010 level. The double top pattern, combined with bearish divergence and the volume profile, sets us up for a potential short opportunity with a strong risk-reward ratio. However, this high-risk reward ratio is balanced by the probability of success because the double top has not been confirmed yet. Something to keep in mind before we continue.
- Potential Double Top: The price has reached a resistance zone around 0.0071010 for the second time as seen on the chart.
- Volume Profile (Visible Range): The volume profile shows that the majority of trading activity occurred in the 0.0065000 to 0.0068750 range, highlighting this zone as a key area of interest for both bulls and bears. The sharp drop in volume at the upper resistance zone (near the 0.0071010 level) indicates weaker buying interest at these higher prices, which is typical when a potential reversal is forming.
- RSI (Relative Strength Index):
- The RSI is currently at 67.10, which is near overbought territory but still within neutral bounds. However, there is a clear bearish divergence between price and RSI.
Short-Term Outlook:
In the short term, the double top pattern and bearish divergence provide a compelling case for a short trade. Traders could look to enter short positions if the price confirms the double top by breaking below the neckline at 0.0068750 or for much higher risk but also a higher reward, shorting if the candle confirms a bearish reversal. This would mean a short would be taken long before the confirmation with the price breaking below the neckline. The initial downside target would be around 0.0065625, which coincides with the volume profile support and the measured move of the double top.
Medium-Term Outlook:
If the double top pattern plays out, the medium-term outlook turns bearish. The price could continue declining towards the 0.0062500 level, where the next significant volume support lies. However, the volume profile suggests that most trading has occurred in the 0.0065000 to 0.0068750 range, making this zone a critical battleground for bulls and bears. A breakdown below 0.0065625 could extend the sell-off further.
Important
Keep in mind that this could be the initial stages of an ascending triangle formation which would mean the downside is limited to 0.0068. (SEE CHART BELOW).

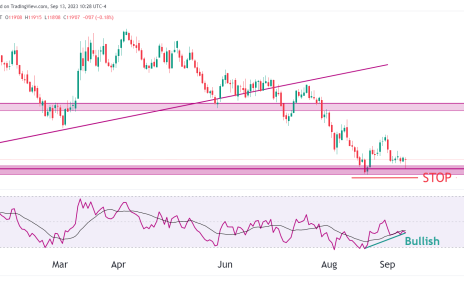
