


Introduction
Gold has once again broken above its all-time high this year, surging past $2,500 per ounce. Think about this for a moment. We have Gold and equities surging at a time when the work is on the brink of war. Investors don’t know where to put their money anymore. Its a time we must stay vigilant and aware of the risks this market could bring.
With that said, lets look at Gold futures and see if we can find any possible trade opportunities to take in the short to medium term.
Technical Analysis
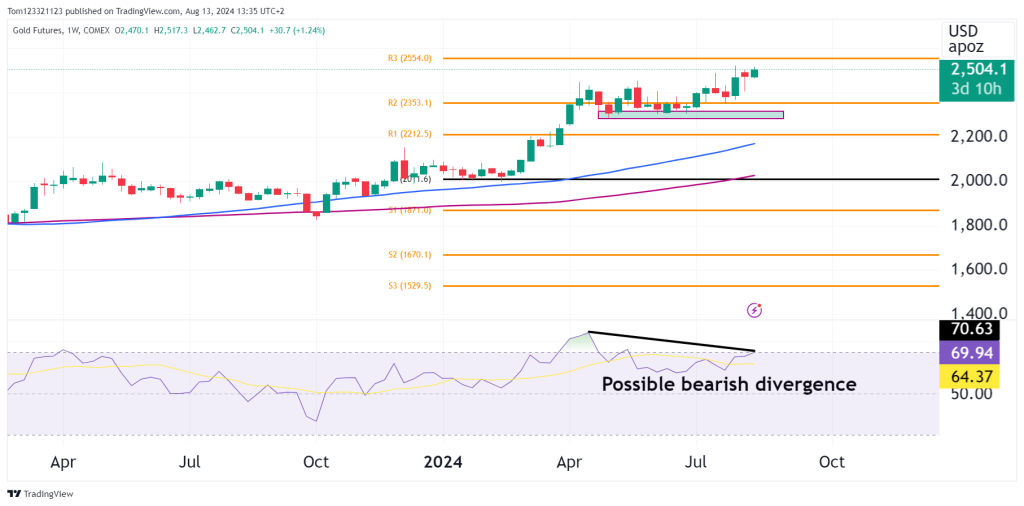
There is a possibility of bearish divergence creeping in on the RSI. It has not confirmed however because the peak is not in but its something we must watch closely. If we see the RSI confirm bearish divergence, we could see some sideways action or a pullback.
However, GC was stuck in a tight range since the start of April and is now breaking out of that range to the upside. It has formed a flag pole pattern as shown in the chart below.
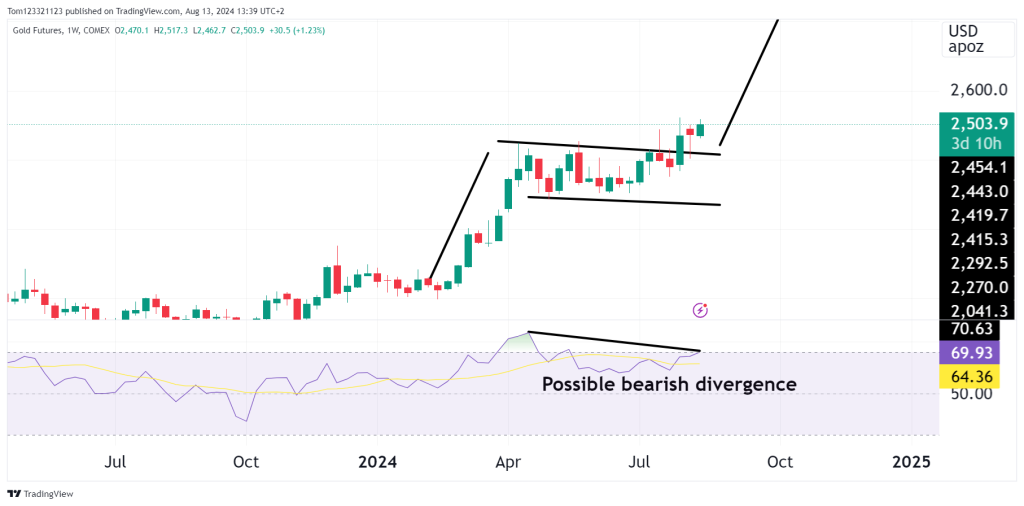
According to this breakout, we could see price rally up to $2,700 but its really a big ask right now.
Trade Opportunities
Short-Term Bearish Setup (Countertrend Play):
- Entry: A short position could be considered if the price shows signs of rejection near the $2,550 – $2,554 resistance area (R3 level) or if a bearish candlestick pattern forms (e.g., a bearish engulfing or shooting star).
- Stop Loss: A stop loss could be placed just above $2,554 to protect against a breakout.
- Target: The initial target could be around $2,400 (R2 level).
2. Medium to Long-Term Bullish Setup (Trend Continuation):
- Entry: If the price corrects or consolidates around the $2,350 – $2,200 support area, look for bullish reversal signals (e.g., hammer, bullish engulfing).
- Stop Loss: A stop loss could be placed below the low.
- Target: The primary target could be the previous high near $2,554, with an extension to new highs beyond this level if the bullish trend resumes.
3. Breakout Play:
- Entry: If the price continues higher a long could be taken.
- Stop Loss: Place a stop loss just below the breakout level at around $2,450 to protect against a false breakout.
- Target: Use Fibonacci extensions or previous highs to project potential targets, with $2,600 and $2,650 as possible upside targets or the extension of the flag pattern.
If you have any technical analysis or a great trade you took with an explanation of your process, please send it to us via our Instagram here or email [email protected] or [email protected]. The trader who sends the best analysis/trade that week will receive a 25% discount code to use on any Evaluation.
