


Introduction
Gold futures (GC) fell 2.01% to $4,054.6 on Monday, extending the mild consolidation that began after prices continued to climb, now up 47% for the year. The pullback comes after the solid move in Gold that was extending, and now some profit-taking has begun.
Technical Overview
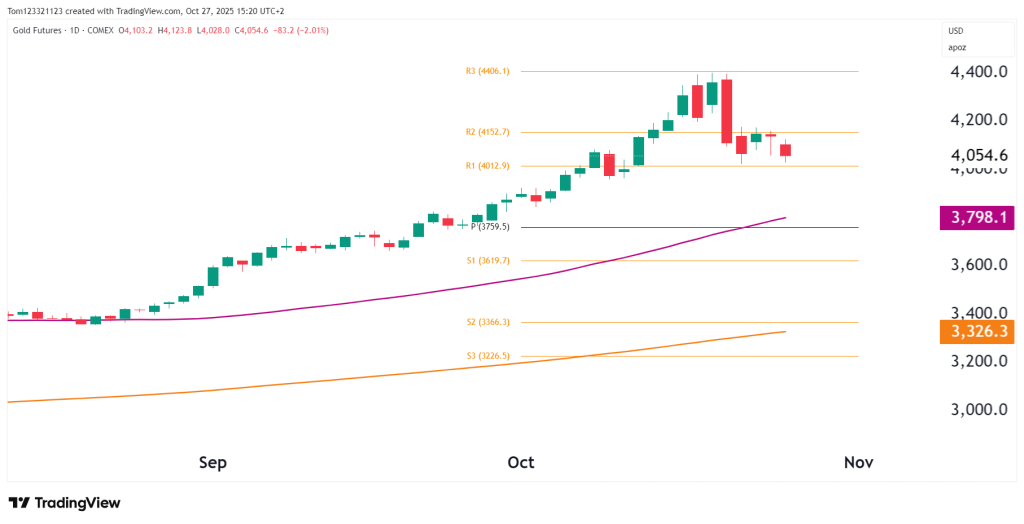
On the daily chart, gold is in a normal pullback within a bigger uptrend. It’s still trading above the R1 pivot level at $4,012.9, using that area as short-term support after backing off from resistance at $4,406.1.
Right now, gold is moving sideways in a narrow range between $4,000 and $4,150, taking a breather after a sharp rally from $3,600 in early September. The 50-day moving average, down at $3,798.1, shows the overall trend is still upward.
If gold holds above $4,000, it could push back toward $4,150 and maybe even $4,300–$4,400. But if it drops below $4,000, the next support is around $3,800–$3,820, where the 50-day moving average and a previous breakout line up.
Right now, this looks like a normal pullback driven by profit-taking, not a sign that sentiment has changed.
Key Technical Levels
| Type | Level | Description |
|---|---|---|
| Resistance 1 | $4,150 | R2 pivot / short-term ceiling |
| Resistance 2 | $4,300–$4,400 | Prior highs / R3 zone |
| Support 1 | $4,012–$4,000 | R1 pivot / near-term floor |
| Support 2 | $3,800 | 50-day MA / key structural support |
| Support 3 | $3,620 | S1 pivot / major breakout level |
Probability Table (Next 2–3 Weeks)
| Scenario | Estimated Probability | Notes |
|---|---|---|
| Continuation of consolidation ($4,000–$4,150) | 45% | Market digesting gains; moderate volatility. |
| Breakout above $4,150 toward $4,300–$4,400 | 40% | Resumption of uptrend if macro risk or inflation concerns intensify. |
| Breakdown below $4,000 toward $3,800 | 15% | Would represent deeper correction or yield-driven profit-taking. |
Fundamentals
Gold has been moving sideways after a big rally driven by global tensions, a weaker dollar, and hopes the Fed might cut rates. But with recent signs of steady U.S. growth and rising Treasury yields, traders are dialing back those rate cut probabilities, causing some to sell off long positions.
At the same time, demand for gold as a safe haven has cooled a bit as stock markets have bounced back. Still, the bigger picture — global uncertainty, slowing inflation, and high government debt — continues to support gold in the medium to long term.
Upcoming U.S. inflation data (PCE) and Fed comments will likely decide if gold starts climbing again or stays in its current pullback.
Summary
Gold is in a steady holding pattern after a strong multi-week rally. Prices are staying above $4,000, and there’s no sign of a breakdown. Momentum has slowed, but the uptrend is still intact as long as gold stays above the 50-day moving average near $3,800.
In the short term, the outlook is neutral to slightly bullish, with a possible move back to $4,150–$4,300 once the pause ends. Longer term, the trend is clearly bullish, backed by strong demand and supportive macro conditions.
This analysis is for educational and informational purposes only and does not constitute trading advice or a recommendation to buy or sell any futures contracts. Futures trading involves significant risk and may not be suitable for all investors. Always conduct your own research and consult with a licensed financial professional before making trading decisions.

