

Key Technical Developments Since Last Analysis:
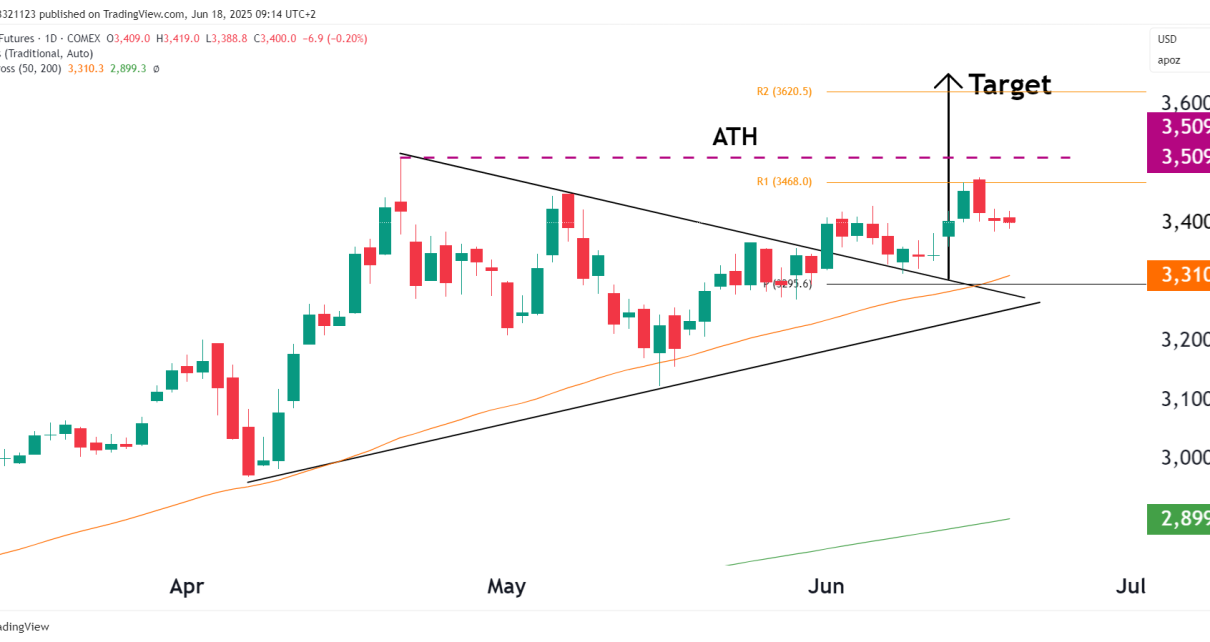
- On June 10, we noted the breakout from the symmetrical triangle, projecting a measured move target toward $3,600, based on the height of the triangle added to the breakout zone.
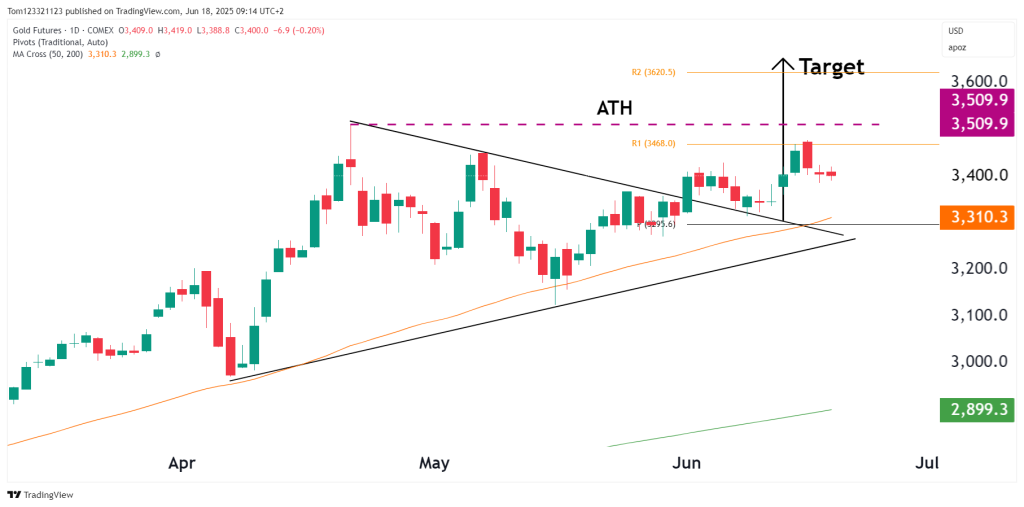
- As of today, price has advanced to $3,400, stalling slightly below the ATH region near $3,510, which is marked on the chart with the purple dashed line.
Technical Analysis
Chart Structure:
The triangle pattern has now confirmed a clean breakout, validated by a bullish expansion in range and follow-through. However, the past 2–3 daily candles are showing small-bodied indecision, implying consolidation just below the key $3,509 resistance level.
Moving Averages:
- 50-day MA: $3,310.3 (acted as support during breakout)
- 200-day MA: $2,899.3 (well below, confirming long-term uptrend)
- The slope of both averages is positive, indicating bullish trend alignment.
Resistance & Target Levels:
- Immediate resistance: $3,468 (pivot R1), then $3,509 (ATH)
- Break of $3,509 could lead to R2: $3,620.5 and projected target ~$3,600–$3,620
- Support now at breakout zone near $3,310 — must hold to maintain bullish breakout integrity.
Momentum Outlook:
- Momentum from the breakout is still present but appears to be cooling as traders approach the psychological ATH zone.
- No extreme reversal signal yet, but caution is warranted unless the $3,510 barrier is cleared decisively.
Outlook:
| Timeframe | Bias | Trigger |
|---|---|---|
| Short-Term | ✅ Bullish (watch $3,510 break) | Break and close above ATH |
| Medium-Term | ✅ Bullish | Price holds above $3,310 breakout zone |
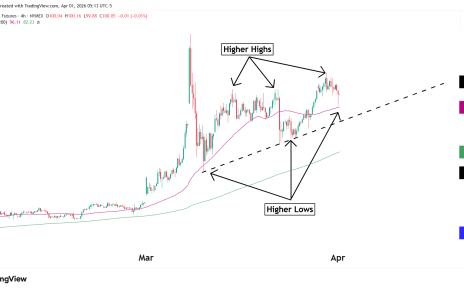
| Long-Term | ✅ Bullish | Macro structure remains higher highs & lows |
Final Note
- If the dollar continues to slide and/or geopolitical tensions persist, Gold remains technically and fundamentally supported.
- Watch for volume confirmation and breakout above $3,510 — that could trigger a momentum acceleration toward $3,600+.
