


- Current Price: $3,311
- Recent ATH: $3,509 (April)
- YTD Performance: 🟢 +~42% (one of the best-performing major assets)
Context: 2025’s Market Chaos Is Gold’s Fuel
Gold’s explosive rally has been fueled by macro turmoil:
- Recession fears (triggered by Trump’s aggressive trade tariffs and global retaliation)
- Dollar weakness (see DXY chart analysis)
- Risk-off flows from equities (ES, NQ in correction territory)
- Safe-haven and inflation hedge bid
Gold has outperformed equities, bonds, the dollar, and even oil. That alone demands attention.
Technical Analysis – Daily Chart Breakdown
Trend Structure: Bullish and Intact
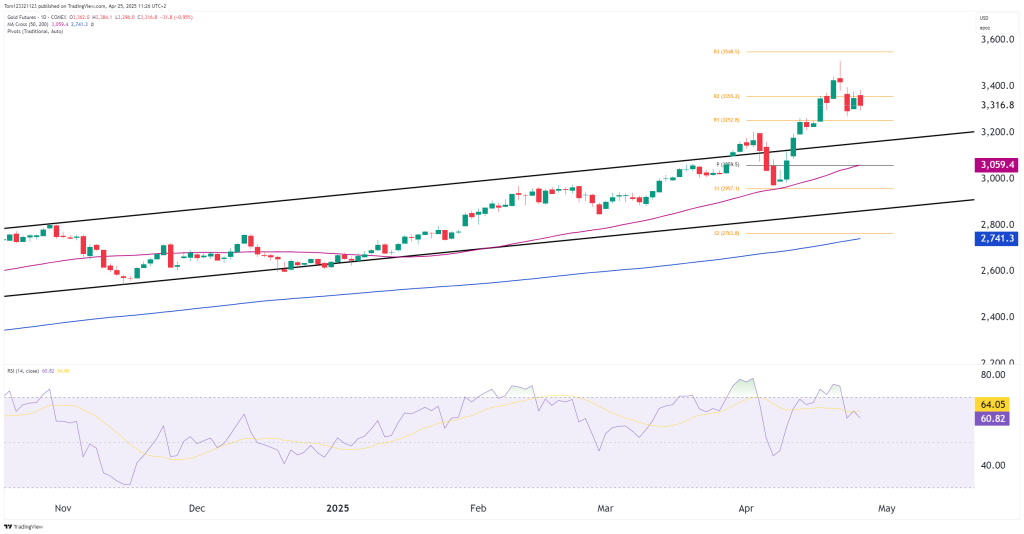
- Price broke above a well-defined ascending channel, with repeated clean bounces off both boundaries
- Still riding comfortably above both:
- 50-day MA
- 100-day MA
- Every dip since Q1 has been bought aggressively — classic bull market behavior
Flag Formation or Consolidation at Highs?
- Price is consolidating just below the recent ATH at $3,509
- A short-term bull flag/pennant is forming — not yet a breakout, but bullish continuation potential
- No lower high yet — pullbacks are shallow
RSI and Momentum Indicators
- RSI at 63.80 → strong but not overbought (plenty of room to run)
- No bearish divergence present
- Volume is elevated on green days, which supports bullish conviction
🟢 Bullish Case
- Macro tailwinds persist (recession fears, weak USD, equity volatility)
- Technicals support continuation: trend is clean, RSI healthy, no topping pattern
Potential Target Ladder:
- $3,400
- $3,548
- $3,741
🔴 Bearish Case
- A sharp reversal in USD or yields could cause unwinding of gold longs
- If 3,059 (50 MA) breaks on volume → we could see a quick flush to 2,800.
- Equities stabilizing and real yields rising would erode gold’s appeal
Summary Table
| Metric | Signal | Interpretation |
|---|---|---|
| Price vs MAs | Above | ✅ Bullish structure |
| RSI | 63.8 | ✅ Still room to run |
| Trend Channel | Intact | ✅ Holding higher |
| Volume on Dips | Dry | ✅ Lack of sell pressure |
| Macro Alignment | Bullish | ✅ Safe-haven flows dominate |
Final Take – Can Gold Keep Outperforming?
| Timeframe | Bias | Key Trigger |
|---|---|---|
| Short-Term | Bullish | Break above (ATH) |
| Medium-Term | Bullish | Higher lows, strong channel intact |
| Long-Term | Bullish | Macro tailwinds remain favorable |
Gold is one of the few assets with clear technical and fundamental alignment. Unless we see a reversal in real yields, or a macro pivot toward risk appetite, gold could continue leading global markets.

