

Introduction
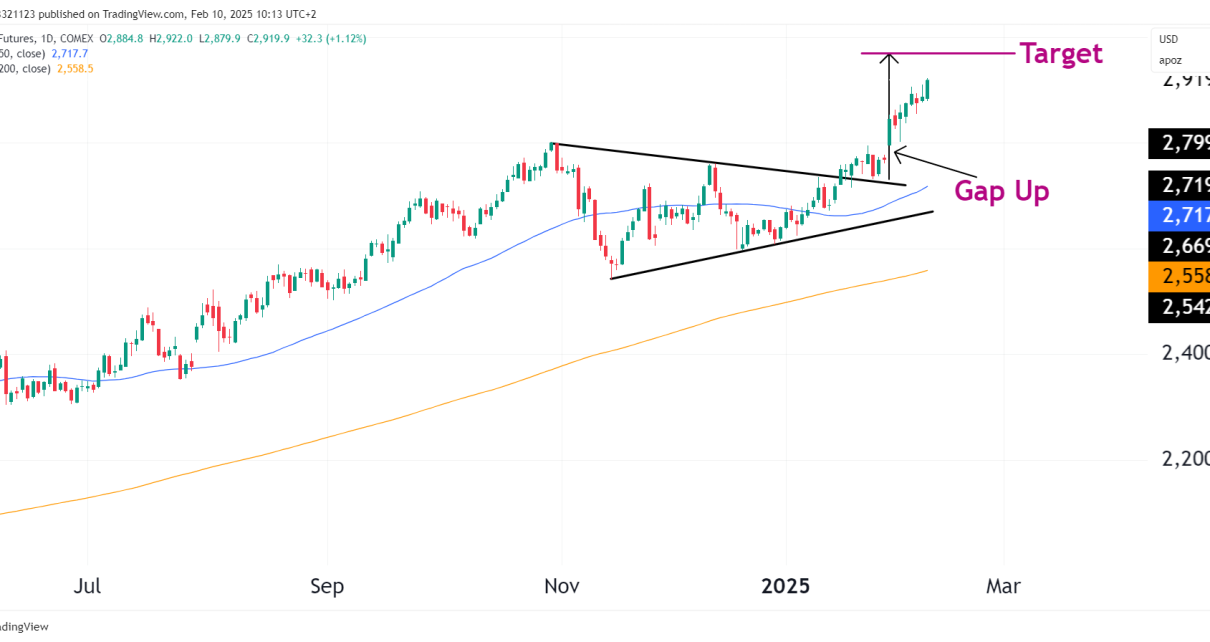
Gold futures have extended their upward momentum following last week’s gap-up breakout. The metal’s price action has confirmed a symmetrical triangle breakout, with prices surging past the ATH.
Technical outlook
Gap-Up & triangle breakout confirm strength
Gold’s breakout from the symmetrical triangle pattern last week triggered a strong continuation rally. The initial breakout was accompanied by a notable gap-up, a sign of aggressive buying interest. Since then, prices have continued to push higher, validating the breakout and sustaining the bullish momentum.
- Breakout confirmation: The price has now decisively cleared the upper trendline of the triangle pattern, confirming a bullish breakout.
- Measured move target: Based on the height of the triangle, the projected target for gold futures stands near $2,975 – $3,000, indicating further upside potential.
Key support & resistance levels
- Immediate Resistance: $2,975 – $3,000 (Measured move target)
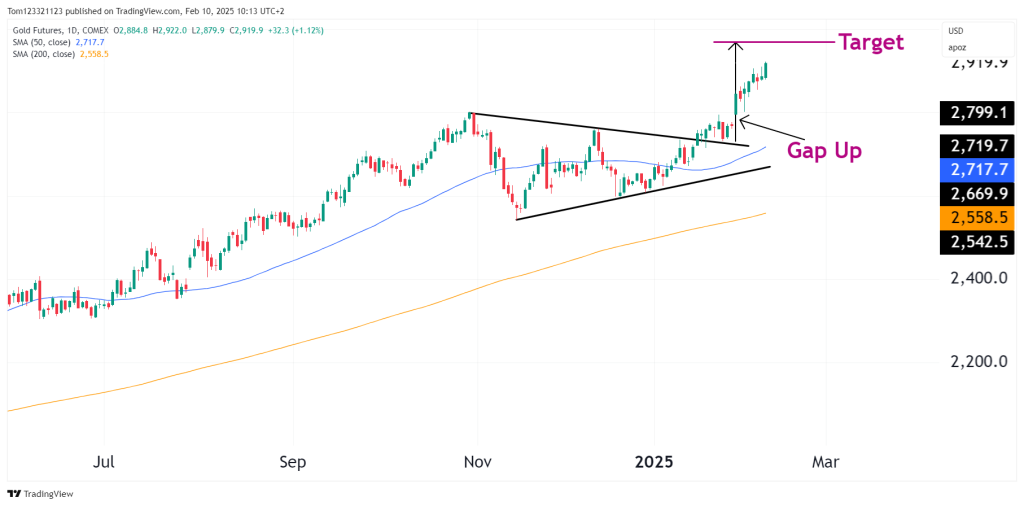
- Current Price: $2,919.9
- Support Levels:
- $2,799.1 (Previous breakout level)
- $2,717.7 (50-day SMA, short-term support)
- $2,558.5 (200-day SMA, strong long-term support)
The 50-day SMA has now turned into dynamic support, reinforcing bullish sentiment. As long as the price remains above this level, the uptrend remains intact.
Technical indicators & market sentiment
Moving averages support uptrend
- The 50-day SMA ($2,717.7) is rising and acting as a support zone.
- The 200-day SMA ($2,558.5) remains far below, so there is a solid uptrend in place on the long-term time frame.
Momentum indicators show strength
- RSI: Likely nearing overbought territory but not signaling immediate weakness.
- MACD: Bullish crossover confirms upward momentum.
With strong bullish sentiment, gold is looking strong, but traders should watch for any signs of exhaustion, especially near the $3,000 psychological level.
Bull & bear case scenarios
Bull case: upside potential to $3,000+
- The breakout is confirmed, and the gap-up adds strength to the rally.
- Momentum remains strong, with moving averages providing support.
- A push toward the $2,975 – $3,000 target is likely in the near term.
Bear case: pullback to retest support?
- If gold fails to sustain momentum, a pullback toward $2,799 (previous ATH) could occur.
- A break below $2,717 (50-day SMA) would weaken the short-term bullish outlook.
Final outlook
- Short-Term (1-2 Weeks): Bullish, targeting $2,975 – $3,000.
- Medium-Term (1-3 Months): Uptrend remains intact unless price falls below $2,717.
- Long-Term (6+ Months): Gold remains in a structural uptrend above the 200-day SMA ($2,558).
The next few sessions will be critical to see if gold can sustain this bullish momentum or if a consolidation phase occurs before the next leg higher. A close above $2,950 could signal a direct move to $3,000, while any pullback toward support levels may present fresh buying opportunities.