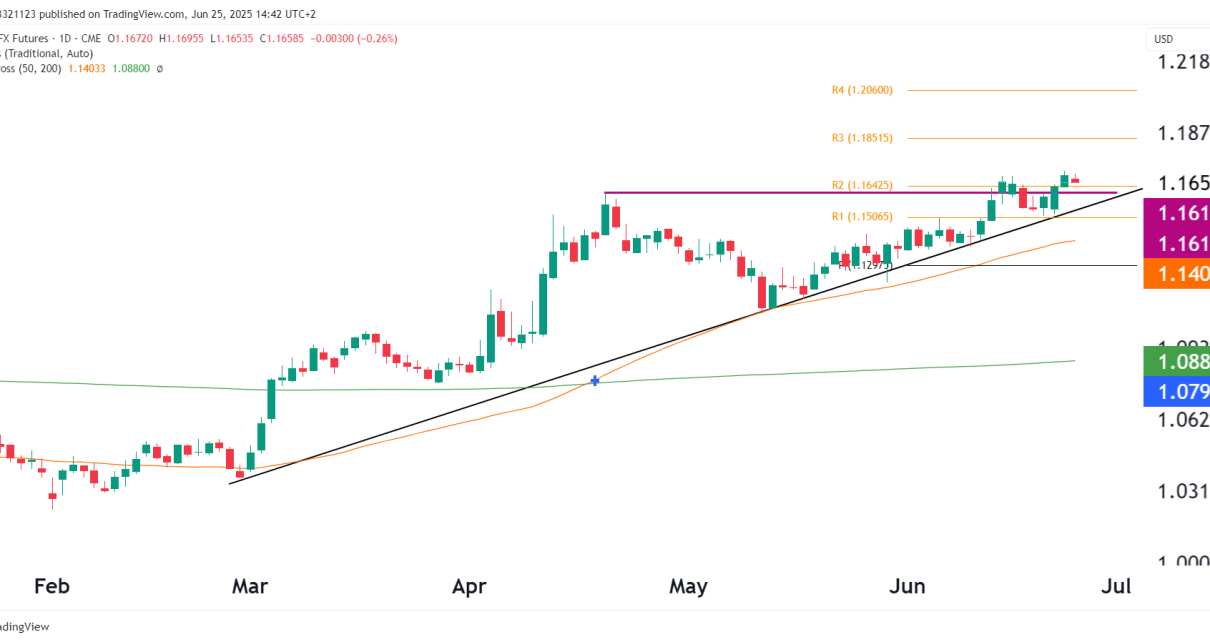
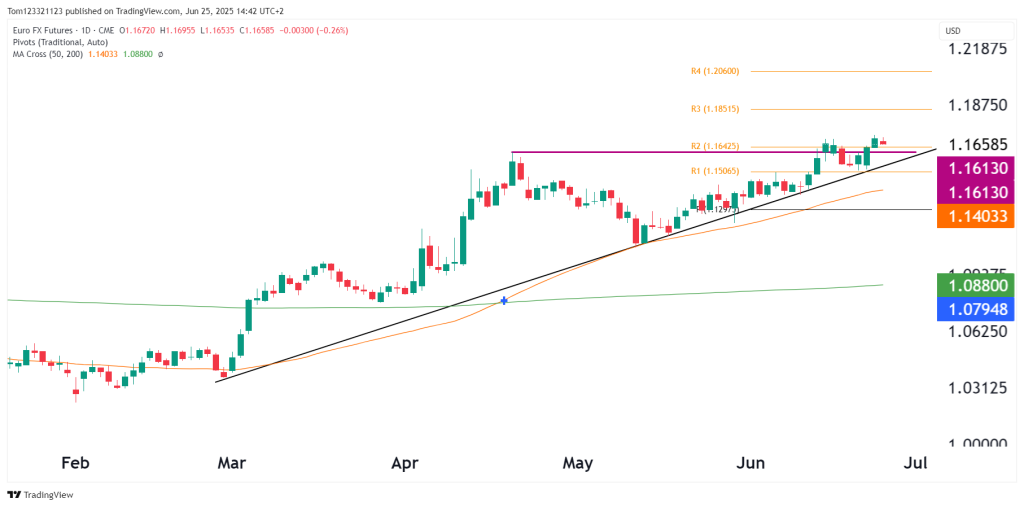
200-day MA: 1.0880 (bullish crossover occurred in late March – momentum has sustained since).
Next Resistance Levels:
R3: 1.1852
R4: 1.2060 These are realistic medium-term targets if 1.164 holds.
Macro/Geopolitical Context
Euro Strength Drivers:
ECB Hawkish Tone: The European Central Bank has remained cautious on premature rate cuts due to sticky core inflation, supporting the euro.
German PMI Beat: Recent economic prints from the eurozone—especially Germany—have shown stabilization, helping underpin euro demand.
Dollar Weakness Catalysts:
Middle East Tensions:
While oil typically boosts USD via risk aversion, recent de-escalations between Iran and Israel are calming safe-haven flows.
The USD is weakening on reduced war premium, and capital is rotating back to risk-friendly currencies like the EUR.
US Macro Softness:
Mixed job data and signs of disinflation are keeping pressure on the Fed to pivot, weakening the USD outlook.
Political uncertainty in the U.S. (Trump legal issues, election volatility) is creating a drag on dollar strength as well.
Probabilities Table
Scenario
Description
Probability
Comment
🟢 Bullish continuation
Price holds above 1.161 and pushes toward 1.185 / 1.206
60% +/-
Structural support intact, risk-on flows favor euro
🟡 Pullback to 1.150–1.155
Brief shakeout before reattempting higher
30% +/-
Would be healthy for trend, esp. if USD catches short bid
🔴 Breakdown below 1.150
Breaks trendline and loses structure
10% +/-
Would likely require surprise ECB dovishness or war reflare
Trade Setups
Trade Idea
Entry Zone
Stop-Loss
Target(s)
Setup Rationale
Trend Long
1.1620–1.1650
Below 1.1580
1.1850 / 1.2050
Breakout pullback entry with clean invalidation and clear risk-reward
Mean-Reversion Short
1.1845–1.1860
Above 1.1880
1.1680
Fade near R3 resistance if overstretched RSI emerges
No Trade Below
<1.1500
—
—
Avoid long setups if trendline is decisively broken
Final Word
Euro FX Futures remain in a structurally bullish phase, with macro and geopolitical factors aligning in its favor—namely a weakening USD on risk-normalization and a stable eurozone policy backdrop. As long as the price stays above 1.161 and trendline support holds, pullbacks remain buyable.
Analyzing the profitable short trade from last week. Recent developments on the daily chart point toward bearish weakness. A true story about a pound-trading cyborg. Recap on the double top progress Last week Tuesday, we looked at the double top formation on 6B futures, seeing the potential for a short trade that had a defined Read More…
🔗 Previous Technical Analysis: Crude Oil Analysis – June 25, 2025 WTI Crude Oil Futures (CL) are holding just above a multi-month support zone, with price currently trading around $68.07, slightly below the 200-day moving average. After recent whipsaw volatility and a brief spike above $75, price has stabilized above the longstanding $66–$68 range, which Read More…
Introduction Euro FX Futures (6E) have rallied but are still in a consolidation period since August, with prices hovering between 1.142 and 1.182. Bulls will be looking to push price above the 50 moving average while bears will be wanting to hold the price below it. The 50 and 200 MA are converging highlighting the Read More…


