Recap
- YM was testing critical horizontal support (~38,950) and clinging to its last consolidation shelf.
- We flagged the risk of a breakdown vs. the possibility of a higher low if price reclaimed $40,000.
Current Status:
Price has stabilized above $40,000, staging a grind higher — yet no breakout has occurred.
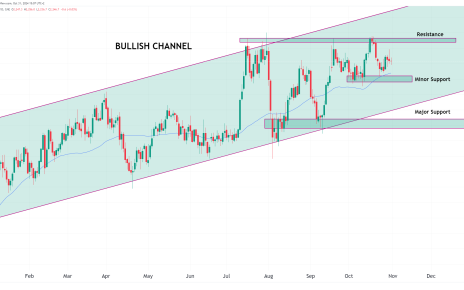
Price Overview – April 29, 2025
- Current Price: 40,429
- Range: Tight, within a compression structure between $38,950 and $40,600
- 200 SMA: 42,417 | 50 SMA: 41,659 — both overhead and flat/sloping down
Technical Picture
Price Action:
- YM has put in a higher low at $38,948 (S2 level), bouncing cleanly off that pivot.
- Price is pressing against minor resistance near $40,600 (S1) but has yet to reclaim the 50/200-day moving averages, which converge above.
- The current pattern resembles a low-volume grind, a common feature of bear market rallies unless resolved with strong upside thrust.
Pivot Levels:
| Support & Resistance | Level | Role |
|---|---|---|
| S2 | 38,948 | Confirmed support |
| S1 | 40,604 | Local resistance → now testing |
| Pivot | 42,362 | Key inflection zone |
| R1 | 44,018 | First bullish breakout marker |
| ATH | 45,176 | Long-term upside target |
Moving Average Confluence
- The 50-day and 200-day moving averages are above price, forming a ceiling between 41,600 and 42,400.
- This zone aligns with the pivot level, making 42,400 a major bullish test ahead.
- Until then, the path higher remains technically constrained.
Probability Table – What’s Next?
| Scenario | Likelihood | Notes |
|---|---|---|
| Bullish breakout > $42,400 | 35% | Needs volume & risk-on macro turn |
| Sideways chop 39,000–41,000 | 45% | Most likely near-term path — indecision persists |
| Breakdown below $38,950 | 20% | Would suggest trend resumption lower |
This current YM chart paints a more neutral-to-cautiously-bullish short-term bias:
- There is technical slow down, but no impulse or confirmation yet.
- Compared to NQ and ES, the Dow has underperformed and lacks momentum leadership — financials and industrials are lagging in the current environment.
However, as long as $38,950 holds, the structure favors accumulation rather than distribution.
Final Verdict
| Timeframe | Bias | Key Levels to Watch |
|---|---|---|
| Short-Term | Neutral | Support at 38,950 / Resistance 40,600 |
| Medium-Term | Neutral to Bullish | Watch for breakout above 42,400 |
| Long-Term | Bullish | Still above macro trendline, ATH in play if macro risk fades |
Until YM reclaims 42,400+ with conviction, traders should remain tactical, not fully directional. This remains a range-bound regime with bullish breakout potential, but unconfirmed for now.