


Introduction
Dow Jones futures (YM) pulled back slightly, but have been rallying alongside the other US indices. The Dow is 1.3% away from the all-time high, and bulls will be trying to push above that in the next few sessions.
Let’s take a look at the technicals and what they are telling us.
Technical Overview
YM Daily Chart Technical Analysis
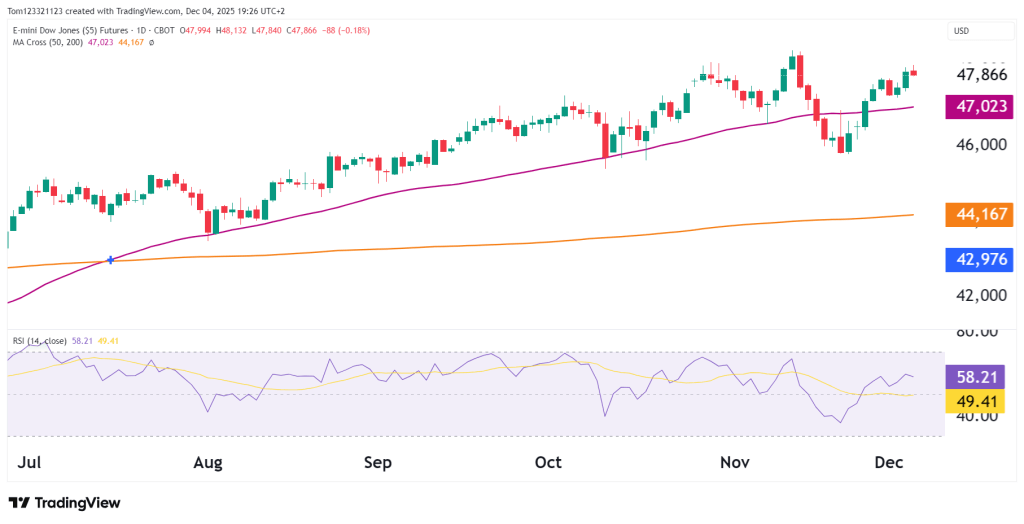
YM continues to trade within a well-defined bullish channel that has been intact since early October. After dipping into the 46,000–46,500 support region late last month, the Dow has since rallied strongly and reclaimed the 50-day moving average at 47,023, turning it into near-term support.
Strong rebound from a key higher-low structure
Last week’s rejection wick off ~46,200 aligns perfectly with the rising trend from July. This confirms that buyers remain in control of the medium-term trend.
The successful retest of the 50-day MA further reinforces this strength.
Price is pressing toward near-term resistance
YM is now approaching the 47,850–48,000 resistance band — an area where price previously stalled in mid-November.
A breakout above 48,000 would likely shift momentum decisively back to the bulls and put the 48,600–49,000 region back on the table as the next upside target.
RSI momentum is improving but not overextended
RSI has climbed to 58, showing rising bullish momentum without entering overbought territory. This suggests there is still room for upside continuation if buying pressure persists.
However, divergence is not present — momentum and price are aligned.
Support levels remain well-defined
If YM pulls back, traders will monitor the 47,000 area closely. Below that, the 46,000–46,500 zone remains a major structural support cluster where buyers have repeatedly stepped in.
Key Technical Levels
Resistance
- 47,850–48,000 → Immediate resistance / recent supply
- 48,600–49,000 → November highs
- 49,500+ → Extended bullish target if trend accelerates
Support
- 47,023 → 50-day MA / short-term support
- 46,500 → Local support from November consolidation
- 46,000–45,850 → Strong demand zone
- 44,167 → 200-day MA (major trend support)
Probability Table (Next 2–3 Weeks)
| Scenario | Estimated Probability | Notes |
|---|---|---|
| Continuation to 48,000+ resistance | 55% | Rising momentum, reclaimed moving averages, strong higher-low base. |
| Sideways consolidation between 46,800–47,900 | 30% | YM often pauses beneath major resistance. |
| Pullback toward 46,000 support | 15% | Would require risk-off sentiment or broad index weakness. |
Summary
YM is still trending up, with momentum improving and price back above the 50-day moving average. The recent bounce has kept the bullish setup intact, but the Dow is now testing the 48,000 area, where sellers stepped in before.
If price breaks above 48,000, it could move toward the November highs. If it cannot break through, YM may pause and move sideways for a bit. As long as it stays above 46,500, the overall outlook remains positive.
This analysis is for educational and informational purposes only and does not constitute trading advice or a recommendation to buy or sell any futures contracts. Futures trading involves significant risk and may not be suitable for all investors. Always conduct your own research and consult with a licensed financial professional before making trading decisions.
