


Introduction
Along with all other US indices, the Dow is dropping as the conflicts in the Middle East continue. Initially, US indices did not react much, but as time goes by, the market is pricing in the developments. The strong dollar is also undoubtedly factoring into the price since YM is priced in dollars, so the stronger the dollar is, the more expensive YM is.
Today we will look at technical levels and mainly what the volume profile indicator is telling us.
What Has Changed Recently
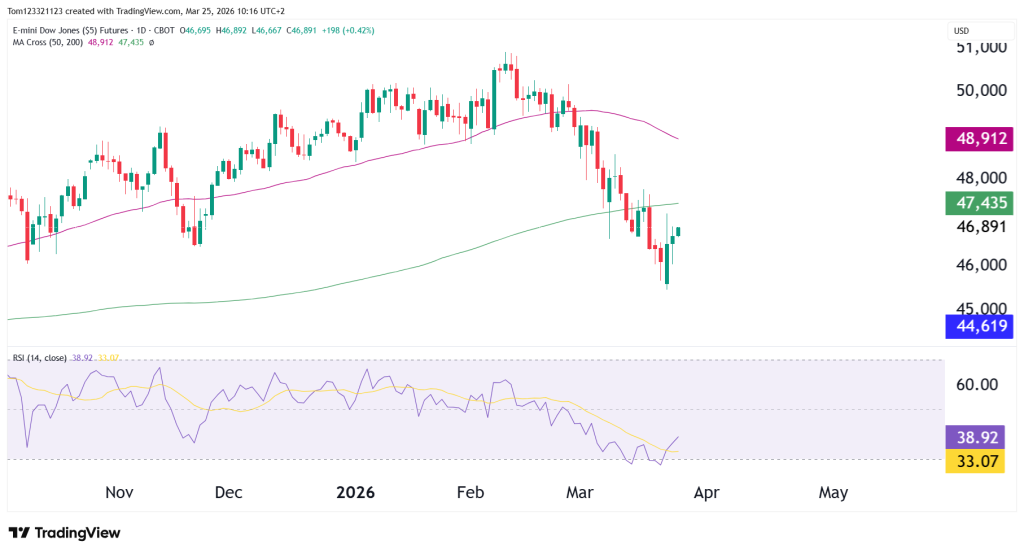
YM is down 10.6% since the top on the 10th of February. Price has also dropped below the 200-day moving average. The RSI is also in oversold territory. All bearish signs, especially when paired with the developments in the Middle East.
The bulls would argue that this could be a strong entry point since the market is oversold. Let’s look at the weekly chart:
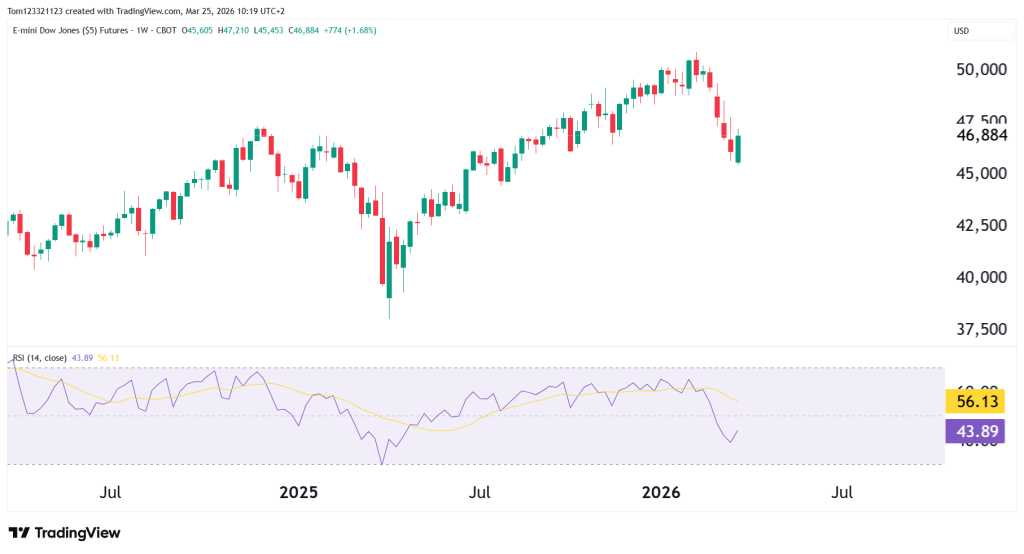
The weekly chart changes the picture slightly and looks like a possible bullish entry.
Volume Profile
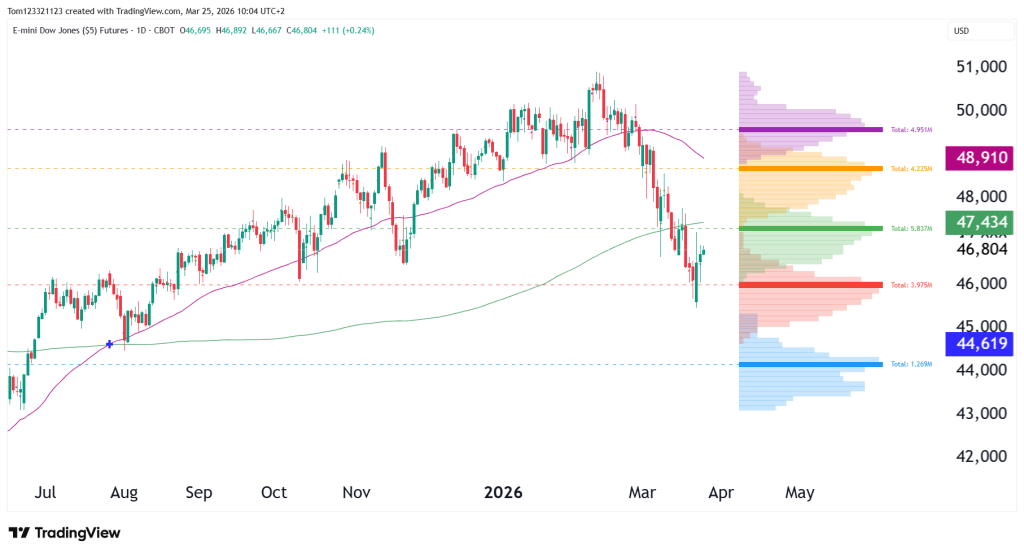
The most important parts of what this indicator is telling us:
- Heavy volume node around 48,000–49,000 (overhead resistance)
- Strong support/value around 46,000–46,500
- Lower volume pockets below current price
Price is currently sitting in a high-interest area, where both buyers and sellers are active.
A move away from this zone could be decisive.
Key Technical Levels
Resistance
47,400 (200-day MA)
Immediate resistance and current test level.
- Rejection here favors downside continuation
- Acceptance above would improve structure
48,800 – 49,000 (50-day MA + volume node)
Major resistance zone.
- Key level for trend recovery
- Likely heavy supply
Support
46,000 – 46,500
Primary support and recent reaction zone.
- Holding this level keeps the bounce intact
- Breaking below opens downside
44,600
Next major support level and lower value area.
Trades
- If price rejects 47,400, expect a move back toward 46,000
- If price breaks below 46,000, downside likely extends toward 44,600
- If price reclaims 48,800–49,000, structure shifts back toward bullish
Probability Table
| Scenario | Description | Estimated Probability |
|---|---|---|
| Bearish Continuation | Rejection near 47,400 leads back toward 46,000 → 44,600 | 45% |
| Range Stabilization | Price holds between 46,000–48,800 | 35% |
| Bullish Recovery | Reclaim of 49,000 leads to move toward 50,000 | 20% |
Final Takeaway
YM is bouncing off an important support level, but the overall trend is still weak.
The key level to watch now is the 200-day moving average, around 47,400. What price does there will likely set the tone for the next move.
As long as the market stays below the 50-day moving average and major volume resistance, this bounce should be viewed carefully.
Right now, the market is reacting rather than trending. It’s better to wait for confirmation than to try to predict the move early.
This analysis is for educational and informational purposes only and does not constitute trading advice or a recommendation to buy or sell any futures contracts. Futures trading involves significant risk and may not be suitable for all investors. Always conduct your own research and consult with a licensed financial professional before making trading decisions.


