

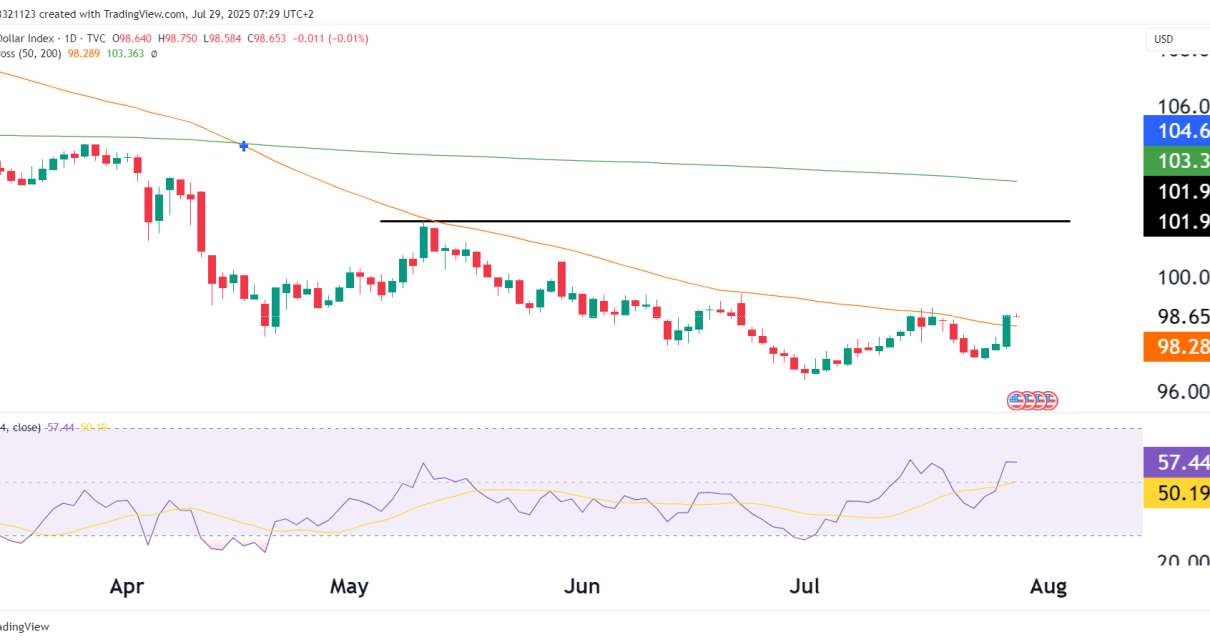
Current Price: 98.653
Daily Change: −0.011 (−0.01%)
Key Resistance: ~101.975 (horizontal)
50-day MA: 98.289 (currently being tested)
200-day MA: 103.363
RSI (14): 57.44 (neutral-bullish)
Technical Structure
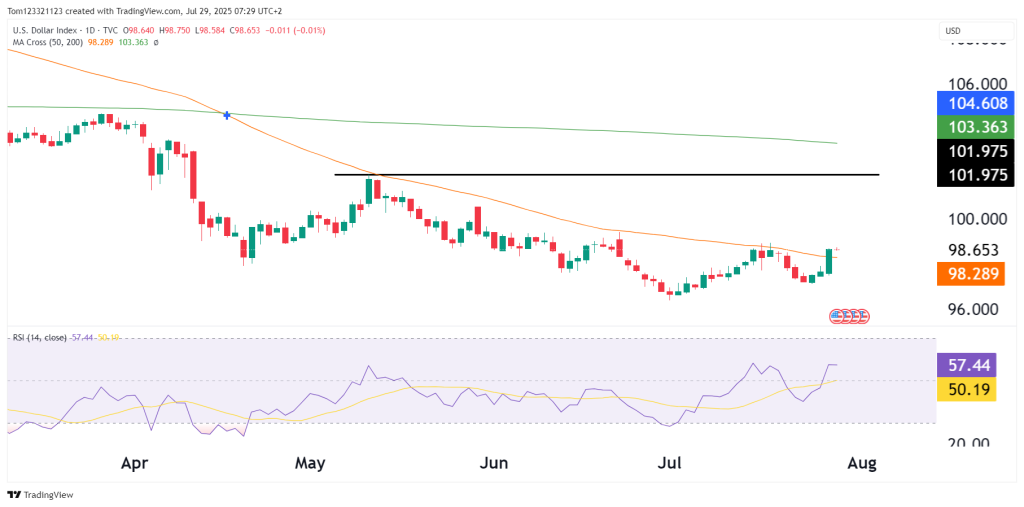
- Trend Context: DXY remains in a broad downtrend, having peaked near 104.60 earlier this year and consistently made lower highs and lower lows.
- Recent Bounce: After bottoming near 97 in mid-July, DXY has printed four consecutive green candles, reclaiming the 50-day MA for the first time in over a month.
- Key Resistance Levels:
- 101.975: Strong horizontal resistance from prior swing highs (May and June).
- 200-day MA at 103.36: Long-term resistance and a potential trend reversal line.
RSI & Momentum
- RSI has broken above the neutral 50 level (now at 57.44), signaling bullish momentum is returning.
- No current signs of overbought conditions.
- If RSI reaches above 60–65 in the coming days, momentum traders may view it as a breakout confirmation.
Interpretation
This recent push through the 50-day moving average and the uptick in RSI show that short-term sentiment has improved for the U.S. dollar. However, this is happening within a broader downtrend, and the DXY remains below major resistance.
Basically, the dollar is staging a short-term rebound, but must clear 101.975 to shift the broader narrative.
Macro Considerations
Bullish Catalysts:
- FOMC Meeting Ahead (early August): A more hawkish Fed tone or resistance to near-term rate cuts could strengthen the dollar.
- Global growth uncertainty: Weakness in China or the Eurozone could drive safe-haven demand for the USD.
- Yen underperformance: BOJ continues to lag, supporting USDJPY and DXY.
Bearish Risks:
- U.S. disinflation trend remains intact, opening the door to Fed cuts by Q4.
- Rising gold and crypto: Suggest markets are hedging fiat weakness.
- Equity strength across all U.S. indices: Diminished need for USD as a safe haven.
Probabilities Table
| Scenario | Estimated Probability | Commentary |
|---|---|---|
| Push toward 101.975 resistance | 45% | Short-term bullish momentum building, Fed may lean hawkish |
| Consolidation around 98.50–99.50 zone | 35% | Mixed macro signals, traders awaiting Fed clarity |
| Breakdown back below 97.50 | 20% | Would likely need dovish Fed surprise or major equity breakout |
Final Take
This recent move in DXY marks a meaningful short-term recovery, but no structural reversal has occurred yet. Traders should treat this as a bear market bounce unless 101.975 is cleared with conviction.
Implications for markets:
- Commodities (like gold and oil): Could face pressure if DXY sustains above 100.
- Equities: May cool slightly if USD strength persists, especially tech and EMs.
