


Current Price: $73.51
Change: +0.73%
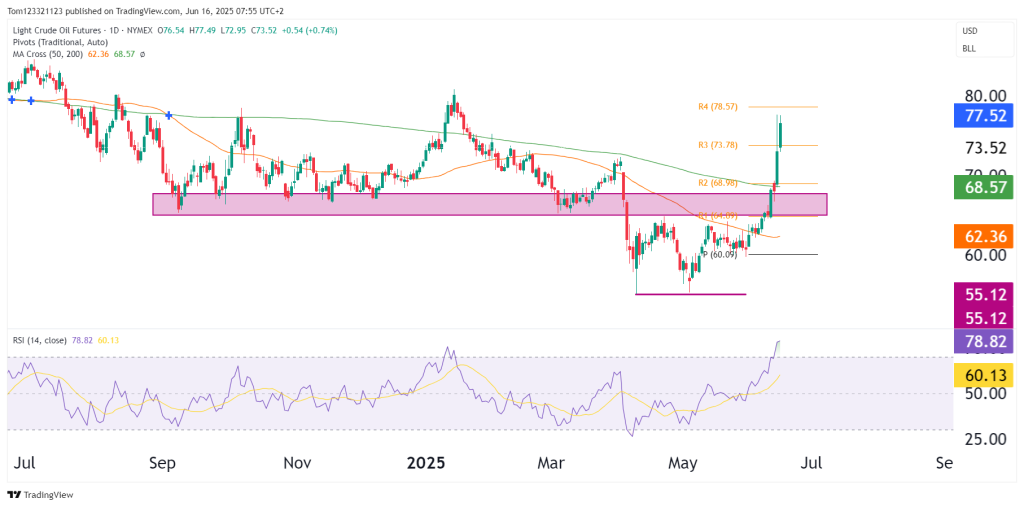
Move from June low: ~$60.09 → ~+22% rally
Key Technicals:
- Breakout above $68.98 (R2) with strength, this level previously capped price for nearly 6 months.
- Price exploded through the 50-day ($62.36) and 200-day ($68.57) moving averages, this is a rare dual MA reclaim, often marking the start of strong trend cycles.
- Price is now testing R3 ($73.78), with R4 ($78.57) next.
- RSI: 78.81 → deeply overbought; momentum is very strong, but short-term pullback is likely.
Crude has triggered a high-momentum breakout from a zone where CL was consolidating for a long time. This wasn’t a grind higher, though; this was a news-driven surge with a technical structure now favoring trend continuation, but with risk of overextension.
Middle East Geopolitical Catalyst
Outlook & Trade Plan
| Term | Bias | Levels |
|---|---|---|
| Short-Term (1–2 weeks) | Overbought / Pullback Risk | Support: $68.98 (R2 retest), $66.00Resistance: $73.78, $78.57 |
| Medium-Term (June–July) | Bullish | Move toward $75–78 likely, contingent on sustained supply fears |
| Long-Term | Event-Driven | Longer uptrend if conflict escalates + supply actually disrupted |
Trading Setup:
- Trade Idea 1 (Pullback Long):
- Entry: $69.00–$70.00
- Stop: Below $67.50
- Target: $75.00 and $78.50
- Rationale: Reclaim of R2 with fundamental catalyst; buying retracement into former resistance.
- Trade Idea 2 (Breakout Continuation):
- Entry: Above $74.00 with volume
- Stop: $71.50
- Target: $78.57 (R4), extension $80.00
- Risk: News reversal or de-escalation
Final Take
Crude oil’s sharp move is the strongest since early 2022 and is backed by legitimate geopolitical risk. Technically, bulls are in full control. As long as price holds above $68.98, momentum and structure support further upside. However, the RSI in overbought territory does warn of a potential pullback or cooling period.


