

In this week’s technical analysis of Crude Oil we will look at the weekly and daily charts. CL is down 26% since its 2023 peak made in September of last year and is currently trading inside of a support zone. Let’s see what the charts say and if we can find some opportunities.
Weekly Chart
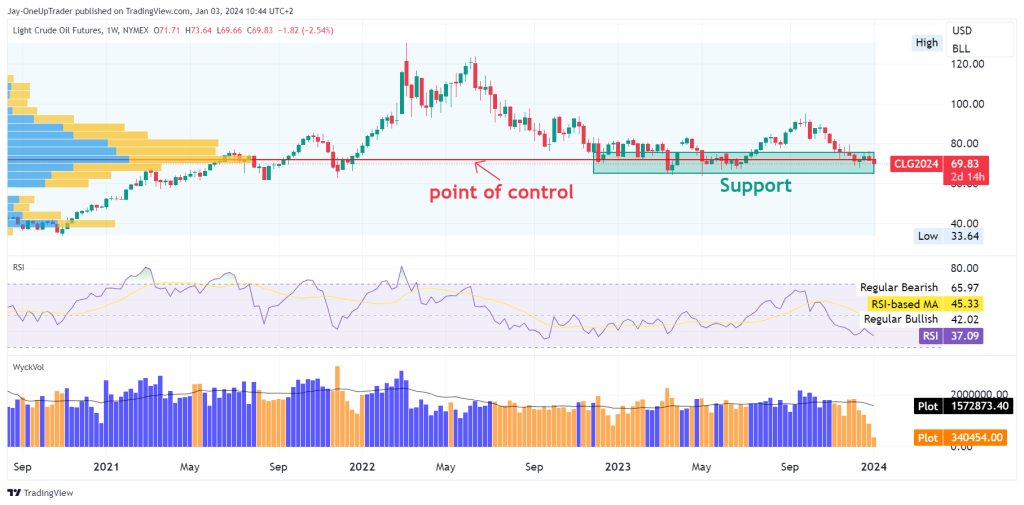
We’ve identified a strong support zone around the $69 level. This is evidenced by the horizontal support line where price has bounced multiple times. The volume profile also shows a high-volume node near this area, indicating significant trading activity that has historically propped up prices. We call this the point of control, a level where buyers and sellers have found equilibrium in the past.
On the Relative Strength Index (RSI), we’re currently seeing a value slightly above 37, which is nearing the oversold territory. This suggests that there could be potential for a bounce back if the bulls gather enough momentum.
Daily Chart
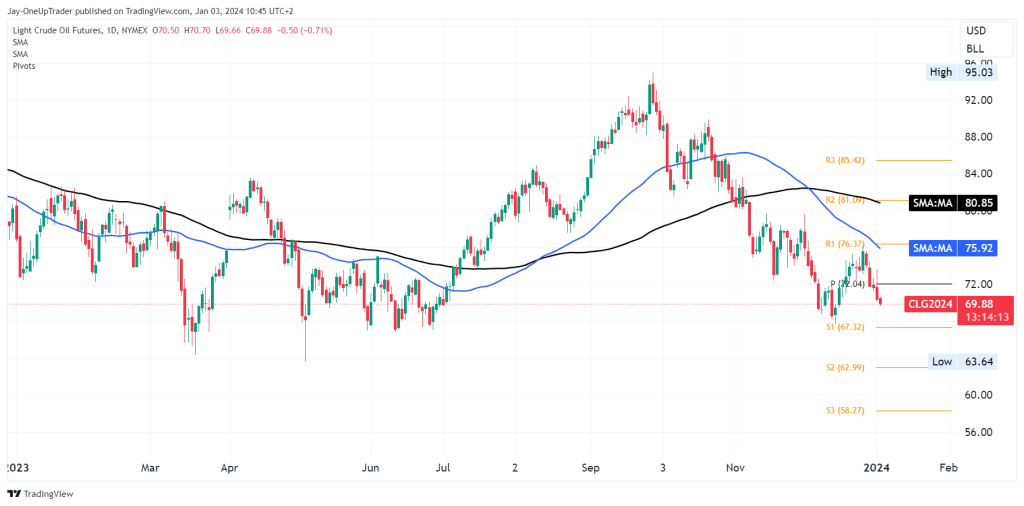
Moving to the daily chart, the price is currently trading below both the 50-day SMA (around $75.92) and the 200-day SMA (around $80.85), which is typically a bearish sign. However, these levels also represent potential resistance zones on any upward move.
Now, let’s talk about trades and levels to watch. Here’s our game plan:
Buying Opportunity:
If you are looking for a long position, keep a close eye on the $69 support level. Should this level hold, and we see a bullish reversal pattern, it could be a good entry point for a long trade. We would aim for a target at the 50-day SMA initially, which could act as our first resistance level.
Selling Opportunity:
For those considering a short position, watch for a break below the $69 support. If we see a strong close beneath this level with increasing sell volume, it could signal further downside. In this scenario, we could target the next support level hinted by the pivots, around the $67.32 mark (S1).
Remember, in trading, there’s no certainty, only probability. We need to weigh our risk and set appropriate stop-loss levels to protect our capital. If we’re entering a long position, placing a stop loss just below the support level might be wise. Conversely, if we’re going short, a stop loss just above the broken support or the 50-day SMA could be the place for it.
Keep in mind, we’re dealing with probabilities here, not guarantees. We’re looking for scenarios where the technical indicators align to give us a higher probability of a successful trade. Monitor these levels closely, and be ready to act if the market moves in our anticipated direction. Stay disciplined with your risk management, and always be prepared to cut losses if the market turns against you.

