


Date: July 30, 2025
Current Price: $69.21
Change (D/D): 0.00%
RSI (14): 59.40 (neutral-bullish)
Key Levels:
- Support zone: $65.00–$66.50
- Resistance: $69.50 (current), $72.00 next
- 50-day MA: $66.02
- 200-day MA: $68.05
Price Structure & Momentum Update
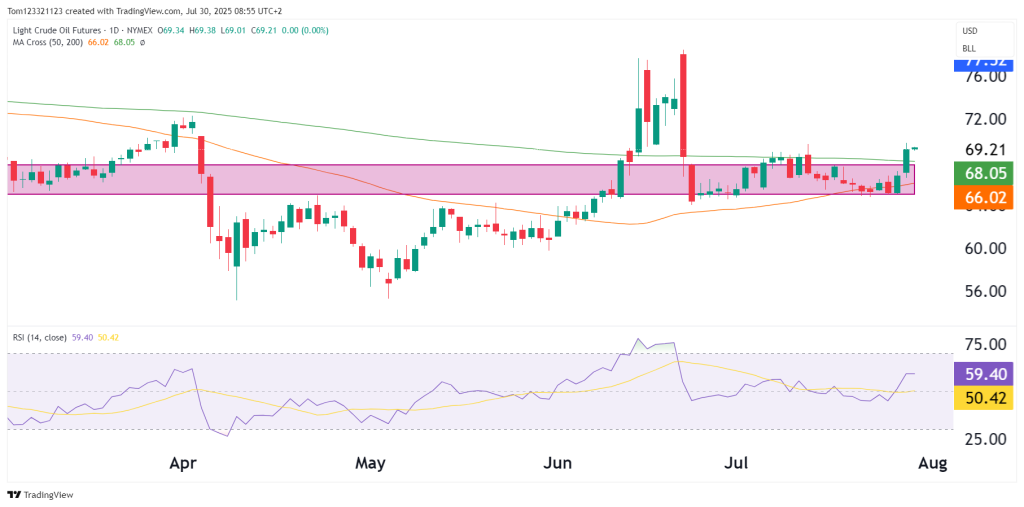
In our last breakdown, we noted that Crude Oil was stuck in a tightening coil within a shaded consolidation band between $65 and $68. As expected, a breakout attempt has now occurred:
- Price has surged cleanly above both the 50-day and 200-day moving averages, reclaiming levels not sustained since late June.
- RSI confirms momentum, now rising steeply toward 60 after weeks of neutrality and a mild bullish divergence.
- The breakout occurred on a neutral candle, suggesting short-term hesitation—but follow-through today or tomorrow would confirm directional conviction.
This is the first proper break above the compression box in over a month, and it’s testing the upper edge of the supply zone from mid-June.
The price is now pressing against major resistance just under $70, where several failed rallies in June and early July stalled. A daily close above $70 would complete a range breakout and initiate a likely move toward $72–$75. However, if bulls fail to follow through, price may drop back into the box and re-test the $66–$67 area.
Risk Factors
- Geopolitical developments (Iran-Israel tension) remain a latent bullish risk, but no fresh major headlines have driven this move.
- OPEC+ remains relatively quiet, though any rhetoric from Saudi Arabia or Russia on production adjustments could ignite volatility.
- DXY strength (as noted in the July 29 DXY analysis) could be a headwind to commodities. Watch for DXY breaching 99+.
Probabilities Table
| Scenario | Estimated Probability | Commentary |
|---|---|---|
| Breakout holds → Move to $72–$75 | 50% | Strong base, bullish RSI, breakout confirmation pending |
| Pullback/retest of $67–$68 zone | 30% | Typical for first breakout attempt to backtest prior resistance |
| Breakdown back into $65–$66 range | 20% | Would require rejection at $70 and broader commodity pressure |
Trades
For Bulls:
- Watch for daily close above $70 for breakout confirmation.
- Targets: $72.00 (minor), $75.30 (pivot resistance), $77.50 (R1 from July 22 analysis).
- Stops: Below 50-day MA (~$66) or breakout base ($67.30) depending on risk tolerance.
For Bears:
- Look for rejection candles or failed breakout above $70 with falling RSI divergence.
- Consider short setups targeting $66.50 retest, especially if DXY surges.
Ending Off
Crude oil has exited its multi-week consolidation, pushing above the 50 and 100 moving averages and testing its range highs. Momentum indicators and structure are aligning, but a decisive daily close above $70 remains key. Until that happens, traders should remain tactical, bullish but cautious.
