


Trend Analysis:

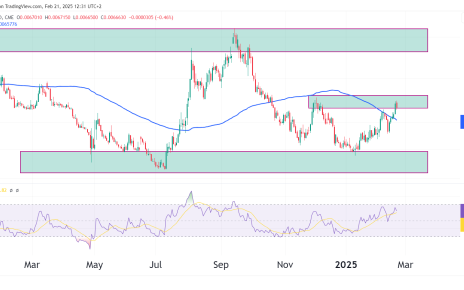
The weekly chart for the S&P 500 (ES) futures has been surging alongside all other US equity markets since November of 2023. After a recent break below the trend line, the bulls stepped back in, and the price began its upward movement once more.
We should not get euphoric though, there is a lot of geopolitical unrest around the world and it could send shockwaves through the markets at any given time.
Current Candlestick:
- The current weekly candlestick (as of the week shown) is red, indicating a bearish week where the price opened higher than it closed. However, the wick below the body suggests there was some buying pressure during the week, pushing the price up from its lows. Bulls need to see price close above its lows for the week for them to have a stronger case moving into the new week.
Bullish/Bearish
- Bullish Perspective: As long as the price stays above the trendline, the overall bullish trend remains intact. A break above the all-time high of 5,721 would be a strong bullish signal, potentially leading to new highs.
- Bearish Perspective: If the price fails to break through the resistance and falls below the trendline, it could indicate a trend reversal or at least a deeper correction. A close below the trendline could bring the next support levels into play, likely around the 5,400 or 5,200 levels, based on previous price action.

Trade Opportunities:
Bullish Scenario:
- Breakout Trade: If the price holds above the pivot level (5,570.50) and then above the first resistance (R1 at 5,708.75), this could signal a bullish continuation. In this case, consider a long position targeting R2 (5,859.25) and potentially R3 (5,997.50). The stop-loss could be placed just below the pivot level or the 50-day moving average (around 5,540).
- Support Bounce Trade: If the price pulls back to the 50-day moving average (around 5,540.38) and shows signs of a bounce, this could offer a good entry point for a long position. The target would be the pivot point at 5,570.50, and if broken, R1 at 5,708.75. The stop-loss could be placed slightly below the 50-day moving average.
Bearish Scenario:
- Pivot Rejection Short: If the price continues to reject the pivot level at 5,570.50 and starts to move lower, a short position could be considered. The first target would be the 50-day moving average at 5,540.38. If this level breaks, look for a move towards S1 at 5,420.00. The stop-loss could be placed just above the pivot level.
- Breakdown Trade: If the price breaks below the 50-day moving average and especially below S1 at 5,420.00, it could signal further downside. A short position could target S2 at 5,281.75 or even S3 at 5,131.25. The stop-loss should be placed above the breakdown level, possibly just above the 50-day moving average.
High Probability Trade:
- Bullish Bias: Given that the price is still above the 50-day and 200-day moving averages, the higher probability trade would lean towards the bullish side. Watch for a breakout above the pivot level (5,570.50) for a long trade with targets at R1, R2, and R3.
