

Estimated reading time: 10 minutes
Introduction
Buying into a powerful trending move can feel uncomfortable. Price has already traveled a long way, the stop is usually really wide, and a few moments after you enter the trade, you second-guess yourself with thoughts like “This market has already moved 300 points, why am I getting in now?” But FOMO hits, and the excitement of “winning” and “being right” overpowers your ability to think rationally and follow your plan.
How do we fix this?
With a plan and system that we can repeat, that doesn’t involve emotional decisions.
The 20 EMA pullback strategy is one way of doing this. Let price establish a direction, allow it to return to the moving average, and watch for the move to continue. You then have a specific entry, a place for the stop, and a target. An actual trade, not a gamble…
This step-by-step guide uses a five-minute chart and the first 30 minutes of the US stock market session to define the setup. The rules form a starting version to test. No backtested win rate is claimed, and the 20 EMA does not make a trade profitable on its own. You need to do the heavy lifting to make it work for you.
What is the 20 EMA pullback strategy?
- Wait for a clear direction after the first 30-minute opening range.
- Let price pull back to the 20 EMA on a five-minute MES or MNQ chart.
- Enter only after a recovery candle confirms the move is starting again.
- Put the stop beyond the pullback extreme; use a 2R target with room to reach it.
- Size the trade from the stop distance — skip it if one contract does not fit.
- Test the full rules first; the 20 EMA alone does not make a trade profitable.
What goes on the chart?
Use Micro E-mini S&P 500 futures (MES) or Micro E-mini Nasdaq-100 futures (MNQ) on a five-minute chart with one 20 EMA. Pick one market and test it on its own, because the two move differently. Keep the chart on the full electronic session, with at least 100 completed bars loaded before the open. Do not reset the EMA at 9:30 a.m.; changing the session template changes the average.
Mark the high and low made between 9:30 and 10:00 a.m. New York time. These become the opening-range boundaries. Also mark the previous regular session’s high and low and the overnight high and low. You will use those levels to check whether a potential trade has room to reach its target.
For the starting version, look for entries between 10:00 a.m. and 12:00 p.m., make no more than one entry attempt per day, and close any remaining position at 12:30 p.m. All times are New York time, which accounts for US daylight saving changes.
These limits keep the method focused on one part of the session. They are settings to test consistently before experimenting with different hours or additional trades.
Understand these points first before reading further.
Step 1: Confirm the direction
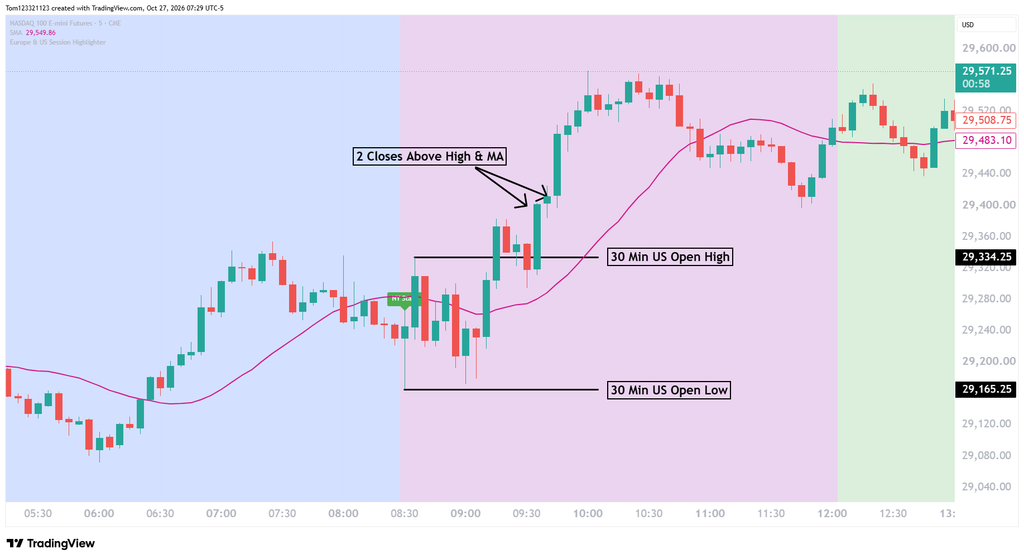
After the opening range is complete, wait for two consecutive five-minute candles to close above both its high and the 20 EMA.
That meets the requirements for a long setup. A wick above the range does not count, and neither does a single close that immediately reverses.
For a short setup, wait for two consecutive closes below both the opening-range low and the EMA.
This filter will miss some moves. If price breaks out and continues without returning to the average, there is no pullback trade to take. Chasing it would give you a different entry and a different risk profile.
Step 2: Wait for the pullback
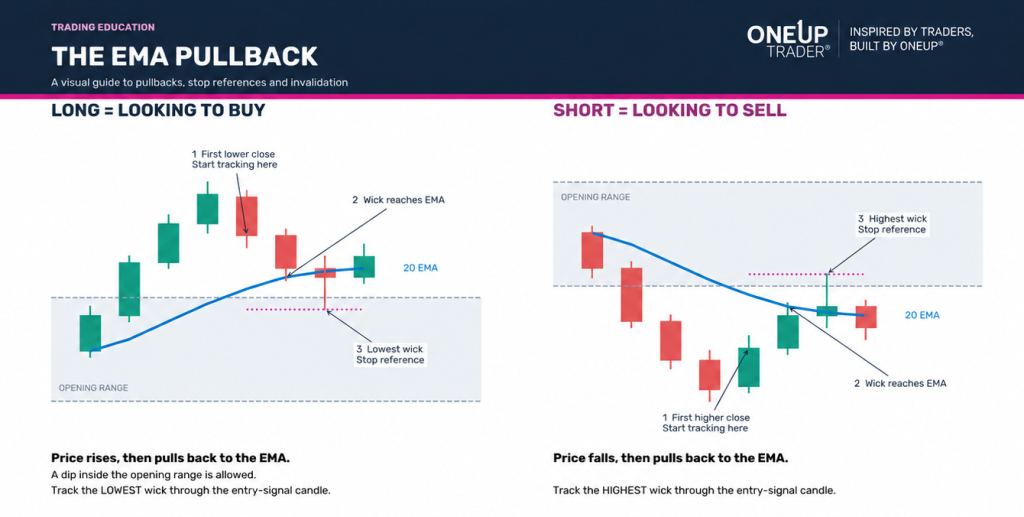
Once the direction is confirmed, wait for the first pullback to the EMA. For a long trade, a candle’s low must touch or go below the EMA. It’s okay if price dips back inside the opening range.
To find your stop level:
Track the lowest price from that candle through the signal candle. That’s your pullback low for the stop.
Start tracking from the first candle that closes below the previous candle’s close—or the first candle that touches the EMA, whichever comes first.
Abandon the long setup for the session if either of these happens before entry:
- A candle closes below the opening-range low. The breakout has fully failed.
- Two consecutive candles close below the 20 EMA. The pullback has turned into a reversal.
For a short, the candle’s high must reach or exceed the EMA. Track the pullback high from the first higher close, or the touch candle if it comes first. Abandon the short setup if a candle closes above the opening-range high, or if two consecutive candles close above the EMA.
Here is an image to show it better
Step 3: Wait for the signal candle
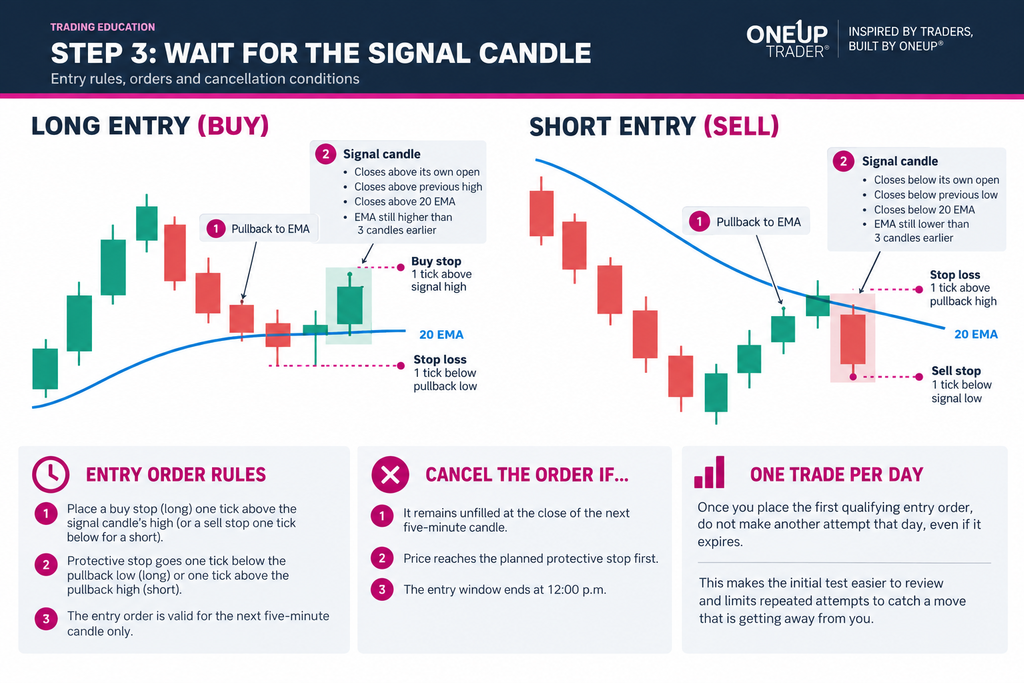
For a long entry, wait for a completed candle that closes above its own open, above the previous candle’s high, and above the 20 EMA.
That is the recovery signal. The candle that touches the EMA can also be the signal candle if it meets every condition.
Place a buy stop one tick above the signal candle’s high and a protective stop one tick below the pullback low. The entry order is valid for the next five-minute candle only. Cancel it if it remains unfilled at that candle’s close, if price reaches the planned protective stop first.
For a short, the signal candle must close below its own open, below the previous candle’s low, and below the EMA, with the average still falling. Place the sell stop one tick below the signal candle’s low and the protective stop one tick above the pullback high. Apply the same cancellation rules.
Once you place the first qualifying entry order, do not make another attempt that day, even if it expires. This makes the initial test easier to review and limits repeated attempts to catch a move that is getting away from you.
Step 4: Check that the target has room
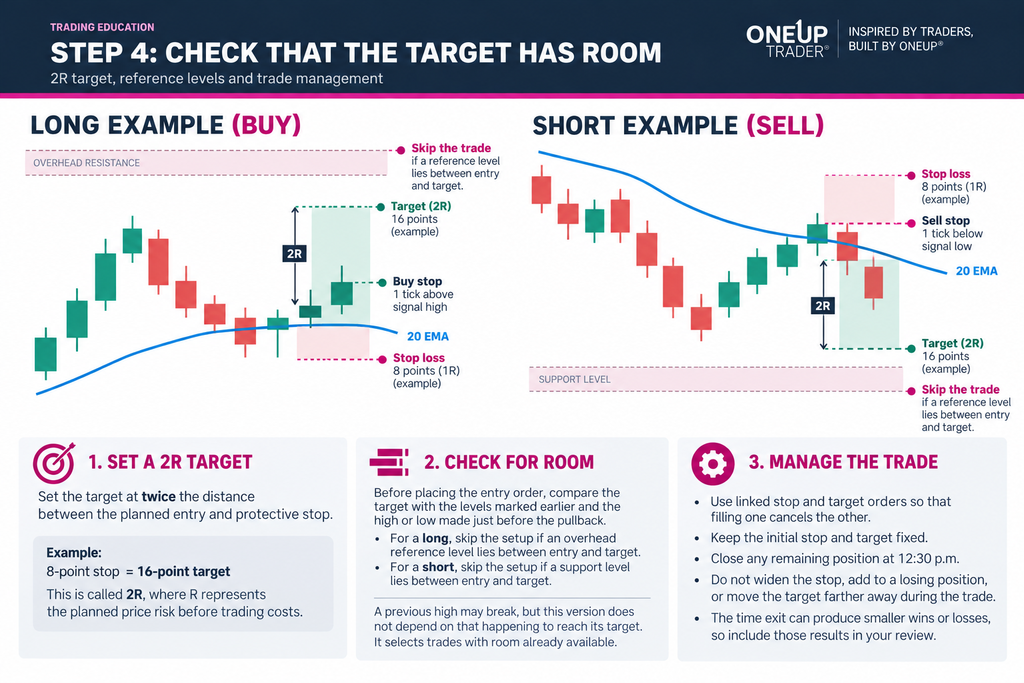
Set the target at twice the distance between the planned entry and protective stop. An eight-point stop therefore requires a sixteen-point target. This is called 2R, where R represents the planned price risk before trading costs.
Before placing the entry order, compare that target with the levels marked earlier and the high or low made just before the pullback. For a long, skip the setup if an overhead reference level lies between entry and target. For a short, apply the same test to support below the entry.
A previous high may break, but this version does not depend on that happening to reach its target. It selects trades with room already available.
Use linked stop and target orders so that filling one cancels the other. Keep the initial stop and target fixed, and close any remaining position at 12:30 p.m. Do not widen the stop, add to a losing position, or move the target farther away during the trade. The time exit can produce smaller wins or losses, so include those results in your review.
A worked example on MES
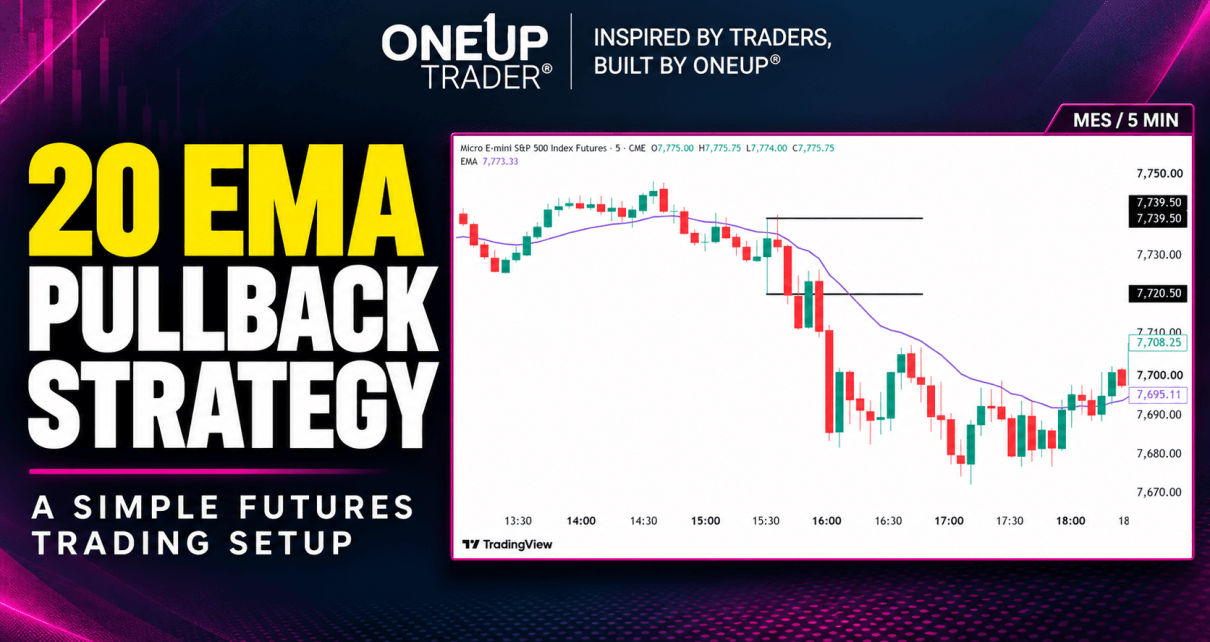
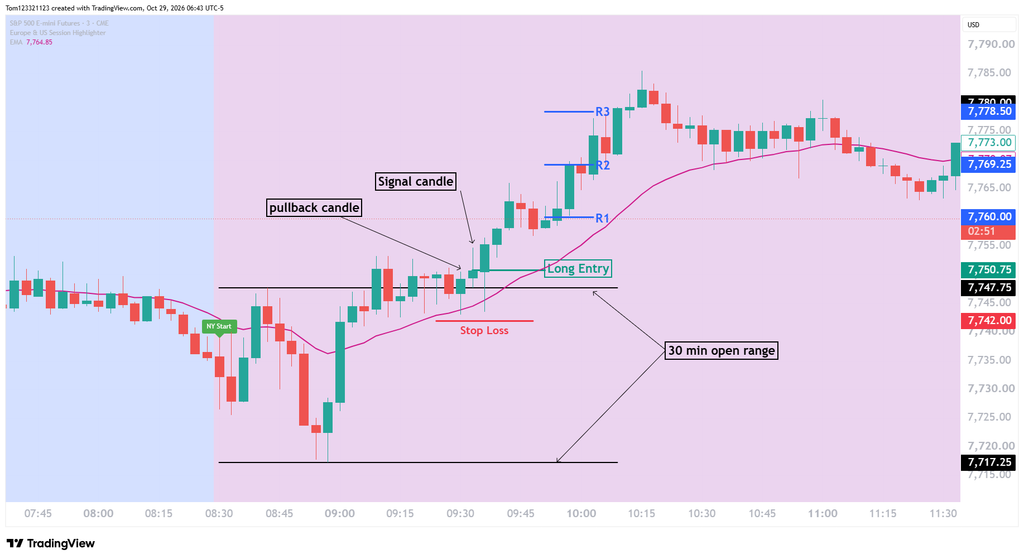
Below is an example of a setup; the black horizontal lines mark the high and low of the opening US session. Price pulls back and touches the ema and the next candle closes above the high so we take a long at that close. Stops are placed below the swing and profit targets are calculated.
If you have any questions on this strategy, come and ask Jay in the OneUp Trader Discord.
How do you size the position from the stop?
Decide the amount you will risk before the session. It should be an amount you can absorb comfortably and repeatedly, including during a losing run. The figures below explain the calculation but they are not a recommended risk amount for every account.
Suppose the risk set is $100. In the example above, one MES contract risks $41.25 before costs, $46.25 per contract including commissions. Two contracts would already use $92.50 of the risk.
Work out how much money you’re willing to risk on the trade. Then calculate how much you would lose per contract if your stop-loss gets hit, including fees and possible slippage.
For example, if you’re willing to risk $200 and each contract could lose $75, you can trade 2 contracts, risking around $150.
Make sure you have enough margin to open the trade. If even one contract risks too much, skip the trade. Never move your stop-loss closer just to trade more contracts.
How should you test the strategy?
Start by recording 50 to 100 qualifying setups across consecutive sessions. Keep a session log that also includes expired orders and days without a trade, so the review reflects how often the setup happens.
Use market replay or detailed price data and make sure that you are testing correctly so the results you get can be trusted when taking the strategy to an evaluation.
Record the net result after costs, whether every condition was met, the average winner and loser, the longest losing run, and the largest peak-to-trough decline in equity. Include the 12:30 p.m. exits rather than treating every trade as a full winner or full loser.
A 2R target needs a win rate above one-third to make money before costs only if every trade ends at exactly +2R or −1R. Fees, slippage, and time exits change those results. The useful numbers are what the strategy actually earns and loses across the sample.
An initial sample is a review point, however. Forward-test the unchanged rules in simulation on fresh sessions before committing capital. If you change the EMA, session window, or exit rules, record it as a separate version so you can tell what changed the outcome.
How do you keep the method consistent?
The 20 EMA gives the pullback a reference point. The opening range defines the direction you are willing to trade, the signal candle provides the trigger, and the pullback extreme gives you the exact stop.
The next step is to follow those decisions long enough to assess them. Keep screenshots, record the trades you skip as well as those you take, and review execution alongside results. A clear set of rules gives you something useful to improve when the evidence calls for a change.
Disclaimer: This article is educational and does not provide personalized investment or trading advice. Futures involve substantial risk of loss and are not suitable for every trader. Examples are hypothetical, and no profitability is guaranteed. Stop orders do not guarantee an execution price.