


Introduction

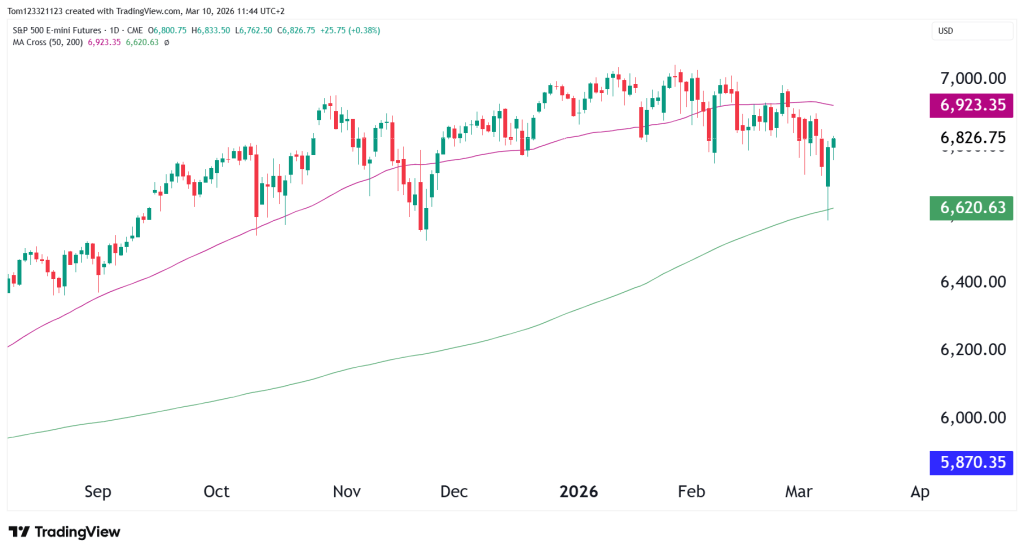
S&P 500 E-mini futures (ES) saw a sharp drop followed by a strong bounce after price tested the 200-day moving average near 6,620. The move occurred after unfortunate escalations in the Middle East where crude oil inventories were attacked.
The reaction in equities shows how quickly markets can shift into risk-off mode when geopolitical developments threaten energy supply and economic stability. ES bounced from the 200-day moving average, ending the day up. The swing was 3.3% from bottom to top.
Let’s take a closer look at the technicals and what they tell us.
Current ES Price Action
The S&P 500 has been stuck in sideways action since October last year. The long term trend is still bullish and any pullbacks have been bought up in the short term. After the events of the weekend, price is currently sitting below the 50 day MA but as we mentioned, bounced strongly from the 200 day MA.
With the volatility around the middle east escalation, traders and investors should be cautious with new positions. With that said, the price action in ES will likely not be as volatile as in CL for example.
Bulls will be trying to regain the 50 day MA, and as long as price remains above the 200 MA then the trend remains bullish.
War Developments & Market Impact
Let’s recap.
Over the weekend and into the start of the week, oil prices jumped sharply after reports of attacks affecting oil infrastructure and worries about global energy supply. When something threatens energy production or major shipping routes, markets usually react fast.
Stocks generally fall when oil prices rise quickly for a few main reasons.
First, higher oil prices raise costs for many businesses. Second, rising energy prices can push inflation higher. Third, geopolitical tension adds uncertainty across the globe. When uncertainty rises, investors go into risk-off mode by selling stocks and moving money into safer assets like bonds, gold, or the U.S. dollar.
The escalation was a big one, and it caused CL to surge 30% in a single day. This sent ripples accross the markets but once price reached the 200-day moving average, longer-term investors seem to have stepped in and supported that level.
This is the most important element on the chart right now, the 200 day MA. It must hold for the trend to remain bullish.
Market Structure & Trend
Daily Chart – 200-Day Moving Average Defense
Key Technical Levels for ES
Resistance
6,900 – 7,000
This remains the most important resistance zone on the chart. Price has been rejected here several times, making it a clear supply area.
A clean break above this level would likely trigger momentum buying and short covering, potentially opening the door toward 7,200.
7,200
The next major upside target if the breakout occurs.
Support
6,620 – 6,650
This area aligns with the 200-day moving average and was just tested during the recent selloff. As long as ES holds above this zone, the longer-term bullish structure remains intact.
6,400 – 6,450
If the 200-day moving average breaks, this region becomes the next major support area based on prior consolidation.
Scenarios Going Forward
Bullish Recovery
If geopolitical tensions stabilize and crude oil prices cool off, ES could continue recovering from the 200-day moving average and attempt another breakout above 7,000.
A confirmed breakout would likely push the market toward 7,200 or higher.
Consolidation Phase
The most likely near-term scenario may be continued range trading between:
6,620 – 7,000
This would allow the market to absorb recent volatility and reset positioning.
This analysis is for educational and informational purposes only and does not constitute trading advice or a recommendation to buy or sell any futures contracts. Futures trading involves significant risk and may not be suitable for all investors. Always conduct your own research and consult with a licensed financial professional before making trading decisions.
