


Introduction
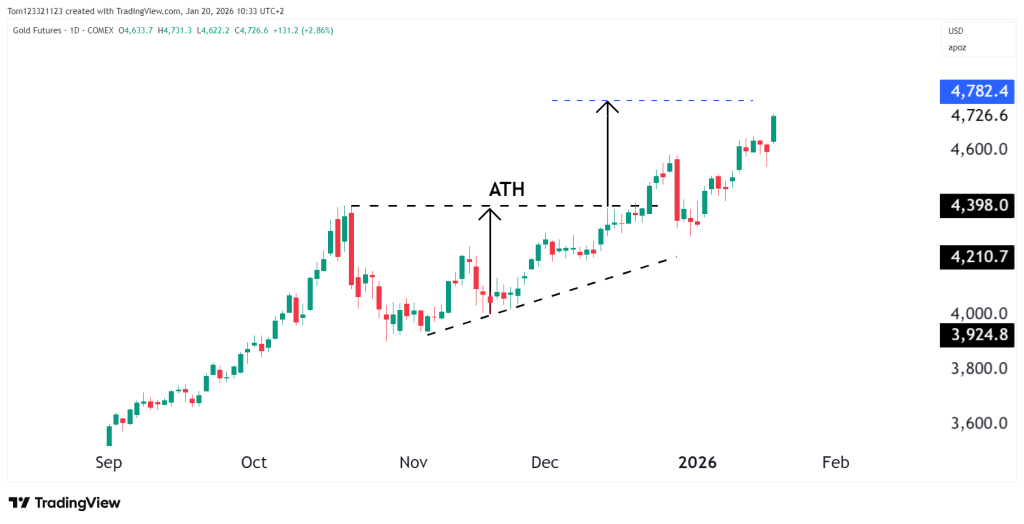
Gold futures have broken above their previous ATH of $4,398, which was forming an ascending triangle. The price action has been firmly bullish after consolidating through much of November. Gold has reaccelerated higher, clearing prior resistance and targeting $4,782.4. With momentum building and structure remaining intact, the focus now shifts toward what type of trend develops from here.
Let’s take a closer look at the technicals and what we can learn from them.
Market Structure & Trend
Daily chart
The daily chart shows a clean continuation of the uptrend, with gold printing higher highs and higher lows. After breaking above the prior all-time high near the 4,390–4,400 zone, price briefly consolidated before pushing aggressively higher, confirming strength above the former resistance.
The breakout is constructive. Former ATH resistance has now flipped into support, and pullbacks since the breakout have remained shallow, suggesting strong dip-buying interest. The rising trendline from the November lows remains intact, reinforcing the bullish structure.
Key Technical Levels
Resistance
- 4,780–4,800: Near-term extension and upside target zone
- 5,000: Major psychological milestone if momentum persists
In price discovery, resistance levels act more as reference zones rather than firm barriers.
Support
- 4,390–4,400: Prior ATH and breakout support
- 4,210–4,250: Rising trendline and prior consolidation
- 3,925–4,000: Deeper structural support if a larger pullback develops
As long as gold holds above the former ATH, the bullish structure remains intact.
Looking Forward
Bullish continuation:
Acceptance above 4,400 keeps gold in price discovery, with upside extensions toward the 4,800–5,000 area if momentum persists.
Sideways consolidation:
Price consolidates above former ATHs, allowing momentum to reset while maintaining the broader uptrend.
Corrective pullback:
A failure to hold 4,390 could trigger a retracement toward the 4,200 trendline, which would still be considered constructive within the larger trend.
Estimated Probability Table
| Scenario | Description | Estimated Probability |
|---|---|---|
| Bullish continuation | Holding above ATH in price discovery | 50% |
| Sideways consolidation | Range above 4,400 | 30% |
| Corrective pullback | Retrace toward 4,200 | 20% |
Fundamentals to Watch
Gold is staying strong for a few main reasons. Investors expect interest rates to come down, central banks continue to buy gold, and there is still a lot of uncertainty about global growth and geopolitical risks. All of this keeps demand for gold steady.
The U.S. dollar and real interest rates are especially important. When the dollar weakens or real yields fall, gold prices usually perform well. Central banks, especially in emerging markets, have also been buying more gold, which has helped support prices over the long term.
With gold trading at record highs, upcoming inflation data, comments from the Federal Reserve, and changes in Treasury yields will play a big role in where prices move next.
This analysis is for educational and informational purposes only and does not constitute trading advice or a recommendation to buy or sell any futures contracts. Futures trading involves significant risk and may not be suitable for all investors. Always conduct your own research and consult with a licensed financial professional before making trading decisions.
