


Introduction
YM has broken above its prior all-time high further showing the strength that all US equity markets have at the moment. Every small dip is getting bought up by the bulls, and the market is firmly bullish. The moving averages are also sloping upward, with the 50 well above the 200, with the price staying above the 50 since May.
Traders and investors are watching U.S. inflation data, labor market reports, and the FOMC, and any bullish developments in any of these will likely result in a push above the ATH. Let’s take a closer look at the technicals and what they are telling us.
Market Structure & Trend
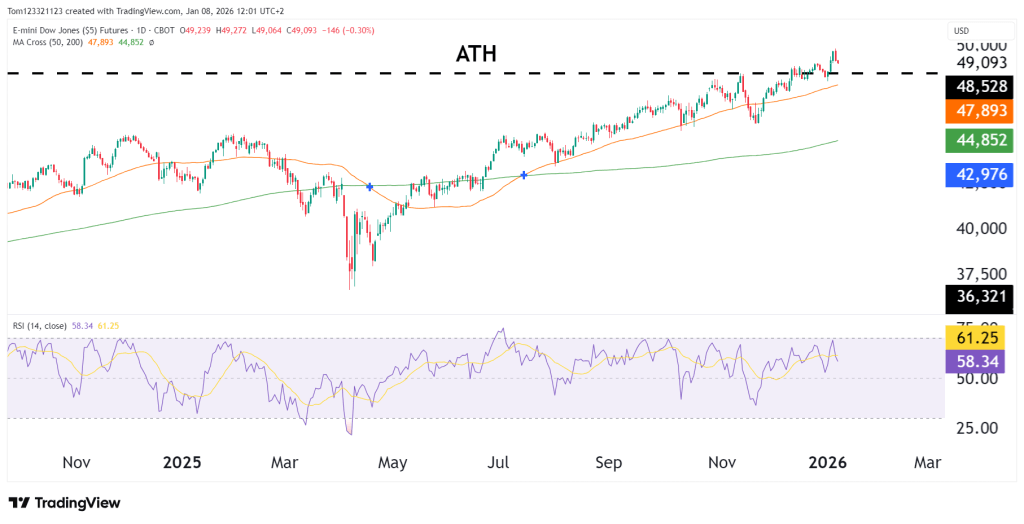
The broader trend remains firmly bullish. YM continues to print higher highs and higher lows, with price holding above both the 50-day and 200-day moving averages. The recent breakout above the prior ATH suggests the trend will likely continue, even as short-term pauses develop.
Importantly, former resistance near 48,500–48,600 has now flipped into support, reinforcing the bullish bias.
Key Technical Levels
Resistance
- 49,200–49,300: Current all-time high zone
- 49,800–50,000: Psychological extension area if momentum resumes
Sustained trade above ATH would keep upside continuation scenarios in play.
Support
- 48,500–48,600: Former ATH, now key support
- 47,900–48,000: 50-day moving average and trend support
- 44,800–45,000: 200-day moving average and broader structural support
Moving Averages
- 50-day MA: Rising and providing dynamic support
- 200-day MA: Strongly upward sloping, confirming long-term trend strength
As long as price remains above the 50-day MA, pullbacks appear corrective rather than trend-reversing.
Momentum (RSI)
The RSI is holding in the upper 50s but still below overbought, this shows that the bullish trend is firmly in tact. Any move below 50 could be a buying opportunity for the traders who are swing trading this trend.
Technical Scenarios Ahead
- Bullish continuation:
Acceptance above ATH leads to further upside exploration toward the 49,800–50,000 zone. - Consolidation above highs:
Price chops between 48,500 and 49,300 as momentum resets. - Deeper pullback:
A rejection back below 48,500 could open a retracement toward the 50-day MA.
Estimated Probability Scenarios
| Scenario | Description | Estimated Probability |
|---|---|---|
| Bullish continuation | Break and hold above ATH | 45% |
| Range consolidation | Chop above former resistance | 35% |
| Deeper pullback | Move toward 50-day MA | 20% |
Fundamentals
YM continues to benefit from strong U.S. equity sentiment, supported by resilient economic data, easing inflation trends, and expectations that monetary policy remains supportive. Industrial and value-heavy components of the Dow have also gained from stable earnings outlooks and rotation away from more volatile growth sectors.
Markets remain sensitive to upcoming U.S. inflation data, Federal Reserve commentary, and earnings guidance, which could influence short-term volatility but have not yet disrupted the broader uptrend.
This analysis is for educational and informational purposes only and does not constitute trading advice or a recommendation to buy or sell any futures contracts. Futures trading involves significant risk and may not be suitable for all investors. Always conduct your own research and consult with a licensed financial professional before making trading decisions.
