


Introduction
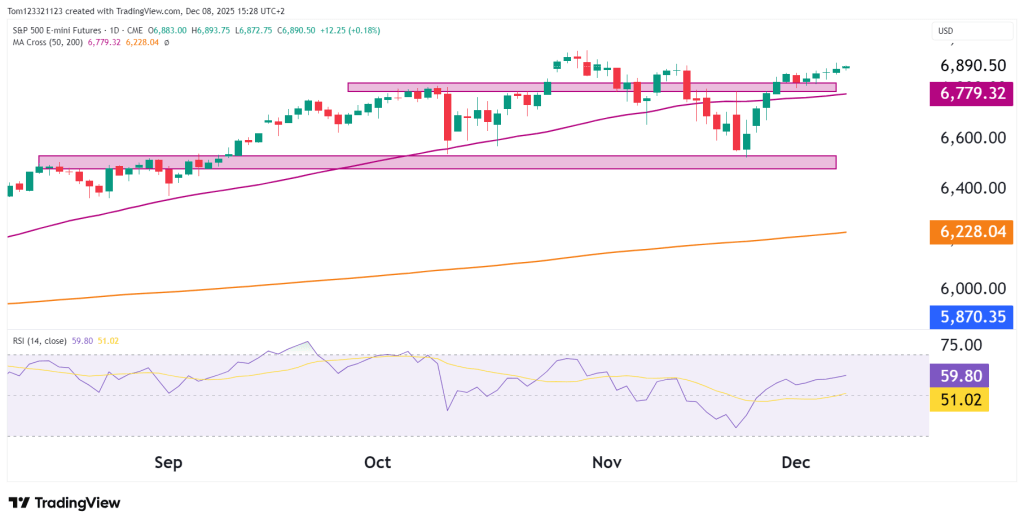
The S&P 500 E-mini Futures (ES) are getting close to testing all-time highs, only a few percentage points away. Bulls have cleared above the 50-day moving average, which will now act as support moving forward. The RSI is coming close to overbought, but now has an upward momentum and isn’t something for the buyers to worry about.
In the coming weeks, ES will also be influenced by several key macro events, including the upcoming FOMC meeting, fresh CPI and PPI inflation data, and the next Nonfarm Payrolls release—all of which could shift expectations around future rate cuts. Treasury yields remain a major driver as well, with upcoming bond auctions likely to create short bursts of volatility.
Let’s take a closer look at the chart structure and key levels developing.
Technical Overview
ES retakes the 50-day MA and holds above it
ES has reclaimed the 50-day moving average (6,779) following a decisive bounce from the 6,650–6,680 support zone. The reclaim reinforces the broader bullish trend and suggests that the late-November weakness may have been corrective rather than trend-changing.
The 200-day MA remains far below at 6,228, keeping the long-term structure firmly bullish.
Price is testing key resistance at 6,850–6,900
ES has returned to the major resistance band that capped rallies throughout mid-November. This zone represents:
- Prior swing highs
- A horizontal supply shelf
- The top of the recent consolidation range
A breakout above 6,900 would open the door to a retest of the all-time highs near the psychological 7,000 handle.
Rising momentum but no overbought conditions
- RSI: 59.57
RSI is climbing but remains below overbought levels, giving the market room to run if buyers maintain control.
Momentum is positive, though the RSI is approaching the same area where ES has stalled on prior attempts, so traders should watch for any divergences.
First support now sits at the reclaimed breakout zone
The 6,720–6,780 region now acts as the first line of defense.
This area combines:
- The 50-day MA
- Former resistance turned support
- A high-volume zone where buyers re-entered aggressively last week
A loss of this area would weaken the short-term structure.
Key Technical Levels
Resistance
- 6,850–6,900 → Major resistance / short-term breakout zone
- 7,000 → Psychological level / potential extension target
- 7,070–7,100 → Next structural resistance if breakout holds
Support
- 6,720–6,780 → First support / 50-day MA cluster
- 6,600–6,650 → Recent demand zone / November lows
- 6,228 → 200-day MA / long-term trend support
Probability Table (Next 2–3 Weeks)
| Scenario | Estimated Probability | Notes |
|---|---|---|
| Breakout above 6,900 → push toward 7,000–7,100 | 50% | Strong rebound, bullish momentum improving, buyers defending trend. |
| Range-bound trade between 6,700–6,900 | 35% | Likely if resistance holds and market pauses into year-end flows. |
| Pullback toward 6,600–6,650 support | 15% | Requires risk-off sentiment or failure at resistance. |
Summary
S&P 500 Futures are still moving higher, back above the 50-day moving average and closing in on the 6,900 resistance area. Momentum supports the bulls, and the overall trend is still strong. A solid push above 6,900 would likely send ES toward 7,000. If it cannot break out, ES may drift sideways between 6,700 and 6,900.
As long as ES stays above the 6,720–6,780 support zone, the short-term outlook remains positive for the bulls.
This analysis is for educational and informational purposes only and does not constitute trading advice or a recommendation to buy or sell any futures contracts. Futures trading involves significant risk and may not be suitable for all investors. Always conduct your own research and consult with a licensed financial professional before making trading decisions.

