


Introduction
The S&P 500 E-mini Futures (ES) have bounced off the 50-day moving average since our previous analysis, with power forming a dragonfly doji. This candlestick pattern has a long lower shadow with the open, high, and close all near the top. This candle normally represents a bullish reversal, and if we pair it with the fact that the general uptrend has been bullish and the candle printed a bounce off the 50-day moving average, it gives even more strength.
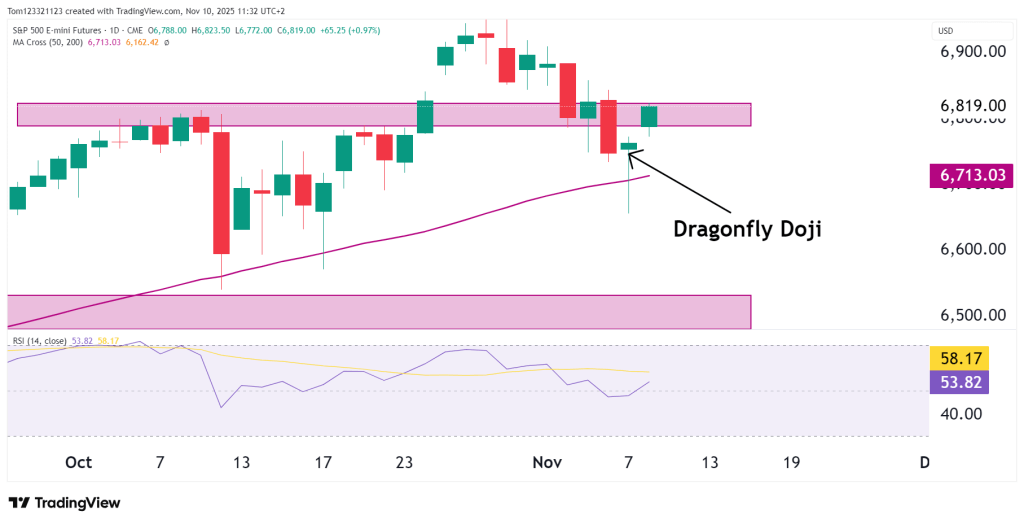
With momentum stabilizing and price action reclaiming the midrange of the recent consolidation zone, ES may now be attempting to form a higher low base, an encouraging sign for bullish continuation into mid-November.
Technical Overview
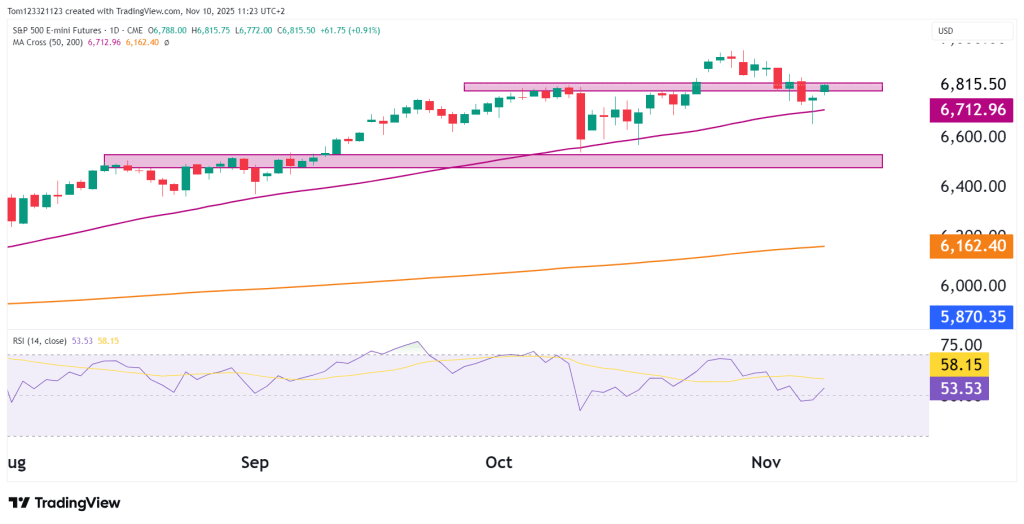
The daily chart shows that ES is bouncing off the 50-day moving average after a small retracement in a long-term uptrend, which has occurred since April. Bulls are already showing strength and targeting the ATH.
Immediate resistance sits near 6,820–6,953, the previous ATH, and a small consolidation range. A clear break and close above this zone would likely reignite bullish momentum and potentially extend toward the 7,000 psychological level.
On the downside, the 6,700 level remains the line in the sand for near-term support. A daily close below this would expose the 6,550–6,500 zone, where deeper buying interest from the September breakout base could emerge. The 200-day moving average (6,162.40) remains well below, confirming that the broader trend continues to favor the bulls.
S&P 500 RSI & Momentum
The RSI (14) has bounced off the 50 level, adding even more strength to the dragonfly doji pattern.
A move above 60 on RSI would confirm renewed strength and likely coincide with a break above the 6,850 resistance area.
🎥 Watch: How to Pass the OneUp Trader Evaluation
Pass the 1-Step Evaluation and become funded. Get insights, rules, and tips from this trader who withdrew $73,000 in one go!
Key Technical Levels
| Type | Level | Description |
|---|---|---|
| Resistance 1 | 6,820–6,850 | Immediate resistance. |
| Resistance 2 | 6,900 | All-time high zone. |
| Resistance 3 | 7,000 | Psychological target. |
| Support 1 | 6,700 | 50-day MA / key short-term support |
| Support 2 | 6,550–6,500 | Secondary support / prior breakout base |
| Support 3 | 6,162 | 200-day MA / long-term uptrend floor |
S&P 500 Probability Table (Next 2–3 Weeks)
| Scenario | Estimated Probability | Notes |
|---|---|---|
| Consolidation between 6,700–6,850 | 50% | Likely short-term range. |
| Breakout above 6,850 → retest 6,900–7,000 | 35% | Requires sustained buying and improved macro sentiment. |
| Breakdown below 6,700 → test 6,550–6,500 | 15% | Would reflect renewed selling. |
Fundamentals
ES is rebounding as Treasury yields ease and the dollar rally pauses, reducing pressure on stocks. Markets are weighing solid U.S. economic data against caution around Fed policy and earnings volatility.
Recent Fed signals point to a data-driven approach, with rate cuts still expected in Q2 2026. This supports equity valuations, while mostly strong earnings suggest the worst of the cycle may be over.
Still, geopolitical risks and sticky inflation could limit near-term gains, making 6,850 a key resistance level to watch.
Summary
S&P 500 E-mini Futures (ES) have bounced strongly off the 50-day moving average, showing bulls still control the trend. The index is consolidating between 6,700 and 6,850, with buyers stepping in near support. A break above 6,850 could restart the uptrend toward 6,900–7,000. But if 6,700 fails, a drop toward 6,550 is possible.
Overall, the setup remains bullish, and the recent pullback looks like a normal correction in an ongoing uptrend.
This analysis is for educational and informational purposes only and does not constitute trading advice or a recommendation to buy or sell any futures contracts. Futures trading involves significant risk and may not be suitable for all investors. Always conduct your own research and consult with a licensed financial professional before making trading decisions.