


Introduction
The S&P 500 E-mini Futures (ES) is hovering just below its all-time high (ATH) near 6,900. The market remains steady following last week’s rally driven by improved risk sentiment and softer U.S. economic data, which helped reinforce expectations that the Federal Reserve will maintain its policy pause. Equities are consolidating at all-time highs so lets take a closer look at the technicals and what they are telling us.
Technical Overview
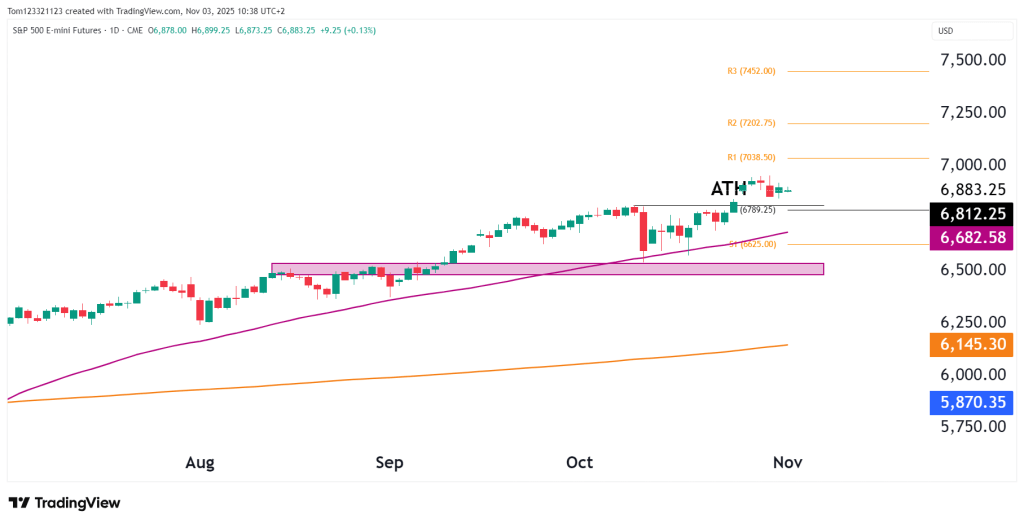
On the daily chart, ES continues to maintain its strong bullish trend, with prices holding comfortably above both the 50-day moving average (6,682.58) and the 200-day moving average (6,145.30). The index’s rebound from the late-October dip near 6,625 (S1 pivot) and the 50-day moving average confirmed the strength of the buyers and the uptrend has continued after that.
Price action has since slowed slightly and is consolidating in a range between 6,870 and 6,900. A decisive breakout above 6,900 (ATH) would likely trigger a continuation rally toward R1 at 7,038.50, followed by R2 at 7,202.75 and the extended R3 target near 7,452.00.
If bulls fail to hold momentum, a minor retracement toward 6,750–6,680 could come, around the 50-day moving average.
Overall, ES continues to look bullish, and sellers would need to establish a lot of strength if they want to challenge that.
Key Technical Levels
| Type | Level | Description |
|---|---|---|
| Resistance 1 | 6,900 | All-time high / breakout zone |
| Resistance 2 | 7,038.5 | R1 pivot / next upside target |
| Resistance 3 | 7,202.75 | R2 pivot / extended bullish projection |
| Support 1 | 6,750 | Near-term price floor |
| Support 2 | 6,682.6 | 50-day MA / dynamic support |
| Support 3 | 6,625 | S1 pivot / former resistance zone |
Probability Table (Next 2–3 Weeks)
| Scenario | Estimated Probability | Notes |
|---|---|---|
| Continuation above 6,900 → target 7,030–7,200 | 50% | Strong structure. |
| Sideways consolidation (6,750–6,900) | 40% | Likely as traders await news. |
| Correction below 6,680 → retest 6,550 | 10% | Requires complete shift in market sentiment. |
Fundamentals
Market sentiment is upbeat after the Fed paused rate hikes, and recent U.S. inflation and jobs data came in softer than expected. This has strengthened the view that the Fed is near the end of its tightening cycle, lifting stocks and pushing the market to new highs.
Still, traders are watching upcoming data like nonfarm payrolls and manufacturing reports, which could shift interest rate expectations. On the positive side, corporate earnings, especially in tech and consumer sectors, have mostly beaten estimates, adding to investor confidence.
That said, geopolitical risks and U.S. fiscal concerns are still in the background, causing some bumps. But as long as yields stay in check and economic data remains steady, the S&P 500 is likely to keep trending higher.
Summary
S&P 500 E-mini Futures are trading just below record highs after a strong Q4 rally. The trend still looks bullish, with technical signals suggesting more upside as long as prices hold above 6,680.
A clear move above 6,900 could kick off the next leg higher toward the 7,000–7,200 range. On the flip side, a drop below 6,625 would be a warning sign of a deeper pullback. For now, the index looks set to keep climbing, as long as market conditions stay favorable.
This analysis is for educational and informational purposes only and does not constitute trading advice or a recommendation to buy or sell any futures contracts. Futures trading involves significant risk and may not be suitable for all investors. Always conduct your own research and consult with a licensed financial professional before making trading decisions.
