


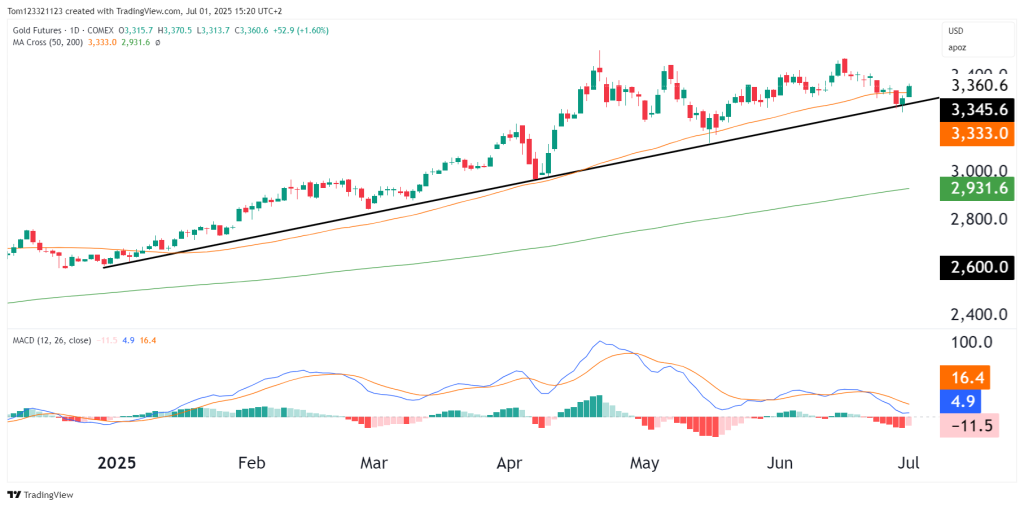
Gold futures rebounded firmly from the trendline and 50-day moving average support after a multi-week pullback. With the U.S. Dollar Index (DXY) continuing to slide and geopolitical tensions simmering, gold’s technical posture is once again flashing constructive bullish signals — though momentum remains in recovery mode.
Technical Overview
| Metric | Value / Status |
|---|---|
| Current Price | 3,360.6 |
| 50-day MA | 3,333.0 (tested and held) |
| 200-day MA | 2,931.6 (strong bullish slope) |
| Trendline Support | Reclaimed on bounce |
| MACD | Still negative, but histogram flattening |
- Today’s bullish candle confirms a defensive reaction off support, preserving the structure of higher lows since late 2024.
- MACD remains below the signal line, suggesting momentum is still soft, but early signs of reversal are building.
Structure and Levels
| Support Zones | Resistance Zones |
|---|---|
| 3,310–3,333 (50MA + TL confluence) | 3,410–3,440 (local supply from June) |
| 3,200 (psychological, minor) | 3,525 (swing high) |
| 2,931 (200MA long-term base) | 3,600+ (projected target) |
Price is now sandwiched between the 50-day MA and a dense resistance band around 3,410–3,440. A daily close above this area would open the door to retesting 3,525 and potentially fresh highs.
Fundamentals
- DXY Breakdown Continues: The USD index remains below multi-month support, reducing headwinds for gold.
- Geopolitical Uncertainty: Iranian-Israeli tensions and an unstable global backdrop continue to push investors toward safe-haven assets.
- Rate Cut Expectations: U.S. rate cut bets for Q3–Q4 remain intact. Lower yields are a tailwind for non-yielding assets like gold.
Trade Scenario Matrix
| Scenario | Probability | Comment |
|---|---|---|
| Bullish continuation above 3,440 | 55% | Breakout from consolidation and DXY weakness supports it |
| Sideways chop (3,310–3,440) | 30% | Needs more momentum to break higher; MACD still lags |
| Breakdown below 3,310 & trendline fails | 15% | Would turn short-term bias bearish, but not base case |
Trade Ideas
| Strategy | Details |
|---|---|
| Swing Long | Buy on dips near 3,320–3,330 with stop below 3,300. Target: 3,520–3,600 |
| Breakout Play | Buy on close above 3,440 with stop near 3,380. Target: 3,600–3,680 |
| Hedge or Short Setup | Only consider if price breaks and holds below 3,300 |
Final Take
Gold’s bounce off trendline support is a technical reaffirmation of the bullish structure, though confirmation requires a move above recent resistance near 3,440. Momentum is improving, but still rebuilding.
Short-term: Neutral-to-bullish
Medium-term: Bullish continuation bias
Long-term: Strong uptrend intact — all dips remain buyable unless 3,300 breaks