


Asset: Light Crude Oil Futures
Timeframe: Daily
Date: April 14, 2025
Current Price: $62.27
Focus: Bounce attempt off support — trend change or just relief?
Technical Overview
Crude Oil has been in a deep selloff from the $80 region, breaking below a year-long support zone between $67–$70, triggering a plunge lower toward multi-month lows of $57.5. However, price is now retesting the underside of that broken support, as the market attempts a short-term bottoming formation around the $60–$63 range.
This area is critical: failing to reclaim $67–$68 means the bears remain firmly in control. But signs of strength here would open a path to recover lost ground and retest higher pivots.
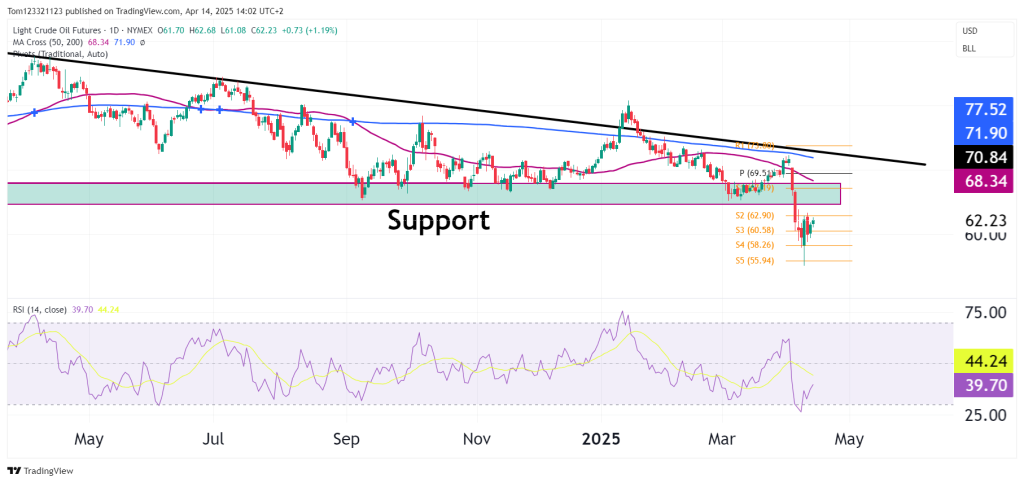
Chart Technicals
Trend & Structure
- Overall trend remains bearish — series of lower highs and lower lows since Q4 2023.
- Price is below both the 50- and 200-day moving averages, which are downsloping, a classic sign of bearish dominance.
- Recent candles show indecision and attempted base building above $60.
Support & Resistance Zones
🔴 Resistance: $67.00–$70.00 → prior support, now a heavy ceiling
🔴 Downtrend line: Pressuring price since mid-2023
🟢 Support zone: $60.00–$58.00 → near March/April lows
🟠 Fibonacci zones are stacked between $58.26 (S4) and $69.51 (Pivot), adding confluence to key areas.
RSI Momentum
- RSI bounced from oversold territory (24.04), now at 39.70 — building potential bullish divergence.
- But still below 50, indicating momentum hasn’t shifted to bulls yet.
Moving Averages
| SMA | Value | Status |
|---|---|---|
| 50-day | 68.34 | Resistance overhead |
| 200-day | 71.90 | Long-term trend barrier |
| Price < both | Bearish alignment |
A return above the 50-day could be the first signal of changing sentiment.
Trade Setups
Short-Term Long — Bounce Play
- Entry: Now ($62.00–62.50)
- Target 1: $64.50 (S2)
- Target 2: $67.00 (lower edge of former support)
- Stop: $59.90
- Why? Oversold RSI, forming a base; risk-reward favors reversion
Rejection Short — Breakdown Continuation
- Trigger: Rejection from $67.00–68.00 zone
- Target: $58.50 then $55.90 (S4/S5)
- Stop: Close above $70.00
- Why? Retest of former support fails; downtrend resumes
Risk Summary & Signals
| Signal | Status |
|---|---|
| Structure | Bearish below $68 |
| RSI | Bearish bias, but recovering |
| MA Trend Bias | Bearish (price < 50/200) |
| Volatility | Elevated but contracting |
| Bullish Break Trigger | Reclaim $70 |
Summary
Crude Oil is trying to stabilize, but the damage is still fresh. Unless bulls reclaim the key $67–70 zone, the chart remains bearish on rallies.
However, the confluence of long-term support, an oversold RSI, and early signs of bottoming suggest that a tactical bounce toward $64–67 is possible.
This isn’t yet the trend reversal — but it could be the start of a base-building phase.
📌 Short-term bias: Tactical bounce
📌 Medium-term bias: Bearish until $70 is reclaimed
📌 Long-term trend: Under pressure, but not broken if price reclaims $72+
