

Weekly Chart Starting with the weekly chart, the E-Mini Russell 2000 Index Futures are oscillating within a defined trading range between approximately $1964.5 and $2000, with the ATH at $2463.7. The index is currently testing the upper boundary of this range. A convincing breakout above the range could signal a strong bullish sentiment, potentially targeting Read More…
Year: 2024
Gold Hits One-Month Low on Surging Inflation
On Thursday, gold dropped to a one-month low as the dollar rose due to hotter-than-expected inflation data. Moreover, hawkish remarks from Fed officials raised concerns that higher interest rates might continue beyond March. The dollar index rose after US consumer prices rose more than anticipated in December because it potentially delays an anticipated US rate Read More…
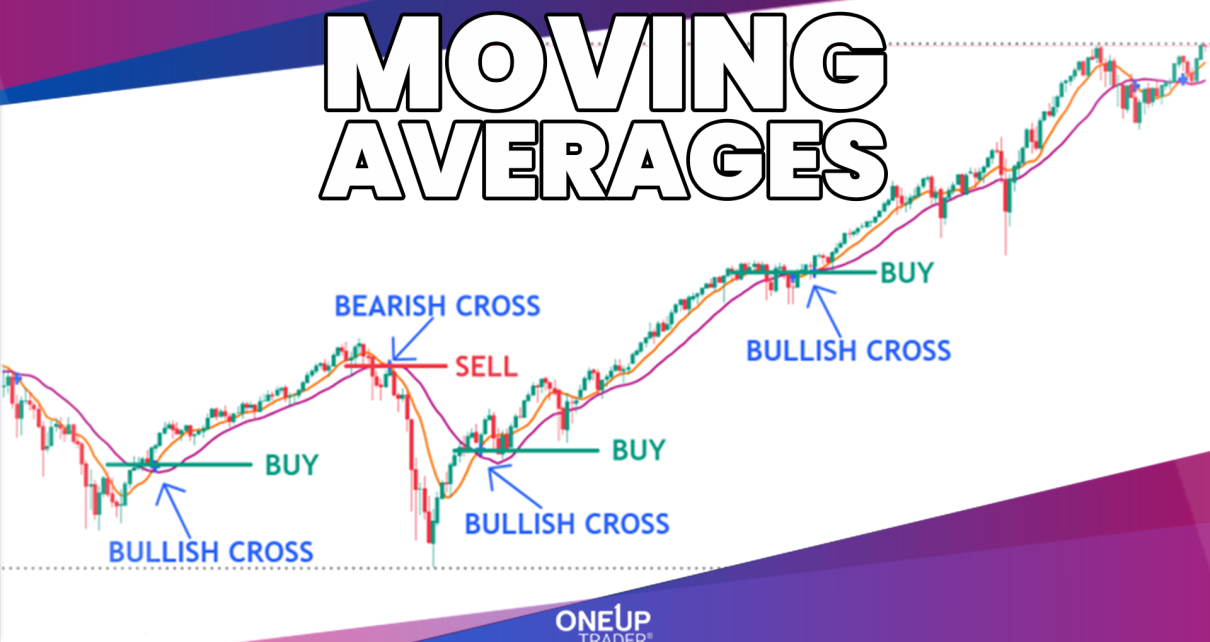
Moving Average Indicator: All You Need To Know
Introduction Traders are always looking for that edge to beat the market – some hidden gem that can help them make easy and predictable profits. Well, you’re in luck because the moving average indicator might just be that secret weapon you’ve been searching for. These powerful yet often overlooked indicators can help you determine market Read More…
US Crude Oil Prices Plummet as Stockpiles Soar
On Wednesday, US crude oil prices fell sharply due to an unexpected increase in US crude stockpiles. The report raised concerns about demand in the largest oil market. WTI futures vs crude stockpiles (Source: Bloomberg, EIA) Despite an initial 1% gain, prices reversed direction following the US Energy Information Administration’s report. There was a surprise Read More…
CL Futures at POC – What’s Next for Oil?
Weekly Chart The weekly chart reveals a battle at a critical level for crude oil futures. A well-defined support zone at $71.50-$72.00 comes into focus, clearly marked by previous consolidation and the volume profile ‘point of control.’ This level represents a pivotal battleground between bulls and bears because it tells us that this is the Read More…
Equities Take a Hit with Treasury Yields on the Rise
On Tuesday, equities ended lower as there was a slight increase in Treasury yields. Moreover, investors were speculating on the timing and magnitude of Fed rate cuts in 2024 and anticipating inflation data later in the week. The likelihood of a rate cut in March has decreased from 79% to 65.7%, according to CME’s FedWatch Read More…
E-mini Dow Jones Futures Technical Analysis
Taking a top-down approach, the weekly time frame shows price exhibiting strong bullish momentum as it rapidly approaches the new all-time highs around 37822 after the previous was broken. The weekly RSI reads 58.82, reflecting neither overbought nor oversold conditions yet and indicating additional room likely remains for this uptrend to continue before exhaustion risk Read More…
Equities Rally Amidst Treasury Yield Decline
On Monday, equities gained as a drop in Treasury yields lifted mega-cap stocks. Treasury yields fell ahead of inflation readings and new government debt supply, with the 10-year US Treasury yield hitting a session low of 3.966%. The Nasdaq and S&P 500 saw their first daily percentage climbs of over 1% since Dec. 21. These Read More…
Gold Futures (GC) multi-timeframe analysis
The weekly chart shows a triple-top reversal pattern forming, with resistance around $2088. This is a pivotal zone – if price can break out above $2088 decisively, it would invalidate the bearish pattern and imply an upside breakout. However, failure to break resistance could confirm the pattern and precede a downward move. The weekly RSI Read More…
Currency Futures Decline as Dollar Steadies Amid Mixed Data
On Friday, currency futures dropped as the dollar remained stable following mixed data from the world’s largest economy. Moreover, the dollar gained nearly 1.1% for the week, marking its best weekly rise since mid-July. The euro weakened slightly against the dollar. This decline ended a three-week streak of increases. Meanwhile, the pound weakened slightly after Read More…