

Introduction
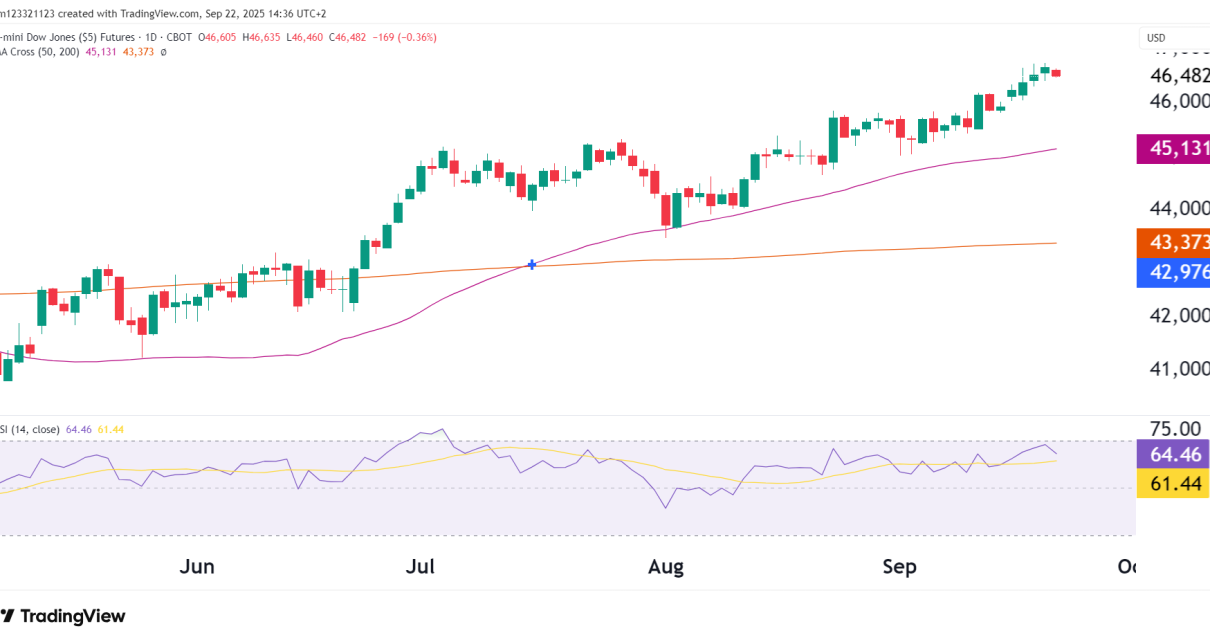
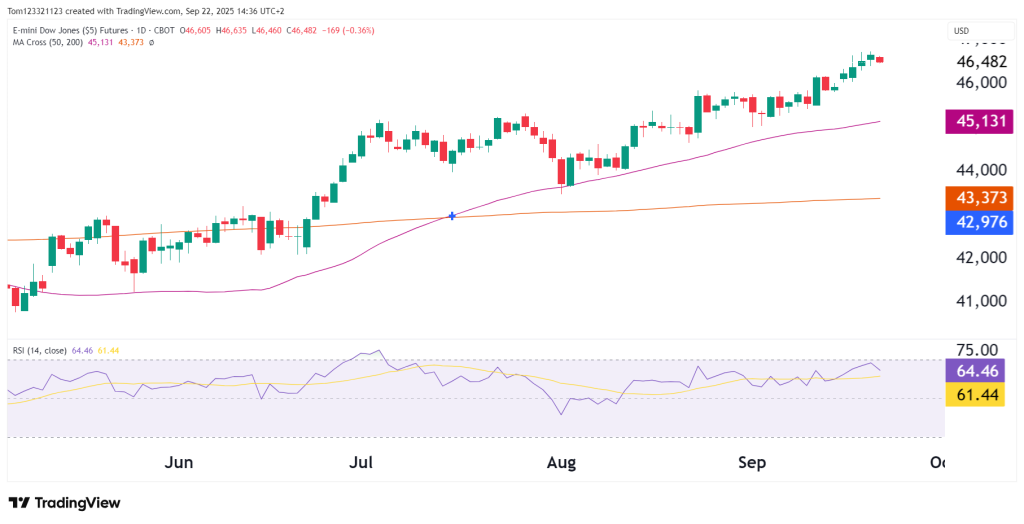
The Dow Jones Futures (YM) have been grinding higher, recently printing 46,488 before cooling off slightly. While momentum has slowed, the index remains firmly in a bullish structure, supported by its moving averages and higher highs.
Technical Update
Trend Support:
Price is holding comfortably above the 50-day MA at 45,131 and the 200-day MA at 43,373. Both averages are sloping upward, confirming that the medium-to-long-term uptrend remains intact.
Momentum:
The RSI sits at 64.59, showing strength but not yet in overbought territory. This provides room for further upside before exhaustion signals flash.
Candlestick Action:
Recent sessions have shown smaller-bodied candles, reflecting slowing momentum after a strong run. This often comes before either a period of sideways consolidation or a shallow pullback before continuation.
Key Levels
| Level | Type | Note |
|---|---|---|
| 46,488 | Resistance | Recent swing high |
| 45,131 | Support | 50-day MA, key short-term floor |
| 43,373 | Support | 200-day MA, broader trend support |
| 42,976 | Support | Secondary downside pivot |
Outlook
- Bull Case:
If YM holds above 45,131, the path toward 47,000–47,500 remains open. A breakout above 46,488 would confirm another leg higher. - Bear Case:
A pullback below 45,131 would indicate waning short-term momentum, opening downside toward 43,373 (200-day MA). Only a break below this level would shift the medium-term outlook bearish.
Ending Off
YM remains in a steady bullish uptrend, supported by rising moving averages and RSI that leaves room for additional gains. However, slowing momentum at 46,488 suggests that the market could pause or retest 45,131 before attempting higher levels. For now, dips should be viewed as healthy corrections within the uptrend.
