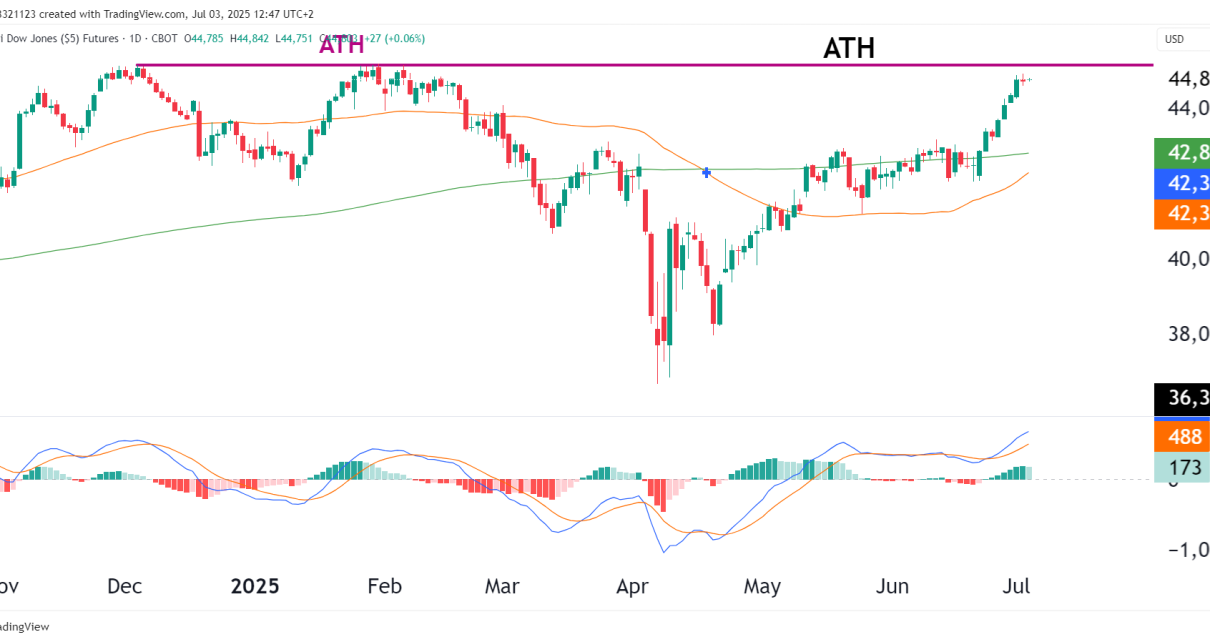
Introduction The Dow is knocking on the door of all-time highs, trading just beneath the ~44,800 resistance zone. With mega-cap indices (like NQ and ES) already in breakout, YM’s late surge confirms a broader market rally, and a potential rotation into industrials and value-heavy components. The weak Dollar is undoubtedly contributing to this. Technical Overview Read More…
Tag: YM
Dow Jones Futures (YM) Technical Analysis – May 27, 2025
Technical Analysis Structure and Trend Any clean break above the 200-day MA opens room toward the all-time high (~43,564). A bullish “golden cross” is not yet active, but a sustained breakout could tilt momentum in that direction. Probabilities Scenario Description Probability Targets Bullish Continuation Holds trendline and breaks above 200-MA High 42,557 → 43,564 (ATH Read More…
Dow Jones Futures (YM) Technicals Mixed
Recap Current Status:Price has stabilized above $40,000, staging a grind higher — yet no breakout has occurred. Price Overview – April 29, 2025 Technical Picture Price Action: Pivot Levels: Support & Resistance Level Role S2 38,948 Confirmed support S1 40,604 Local resistance → now testing Pivot 42,362 Key inflection zone R1 44,018 First bullish breakout Read More…
Dow Jones futures test bullish trendline
Introduction E-mini Dow Jones futures (YM) have rebounded off trendline support, regaining strength after a recent pullback. Price tested the ascending trendline and the 100-day VWMA (43,610), holding above these levels and keeping the long-term uptrend intact. Market Drivers & Key News Events Technical Analysis Bounce from Trendline—Higher Lows Intact Key Support & Resistance Levels Read More…
Dow Jones Futures (YM) Needs To Catch Up!
Introduction The Dow Jones futures (YM) have lagged behind the other indices in 2024. The industrial average has still put in some good gains, up 11% for the past year but only 2.9% YTD. The S&P 500 (ES) is up 22% for the past year. Do we think its time for the Dow to catch Read More…
Dow Jones Futures (YM) Technical Analysis & Trades
Dow Jones Futures (YM) have slightly underperformed by about 5% vs. ES and NQ, but nevertheless, the trend is bullish. The key feature on the daily chart is the ascending triangle formation, which gives us a target at the 200% FIbo level. This is the bullish target for the medium term. Keep an eye out Read More…


