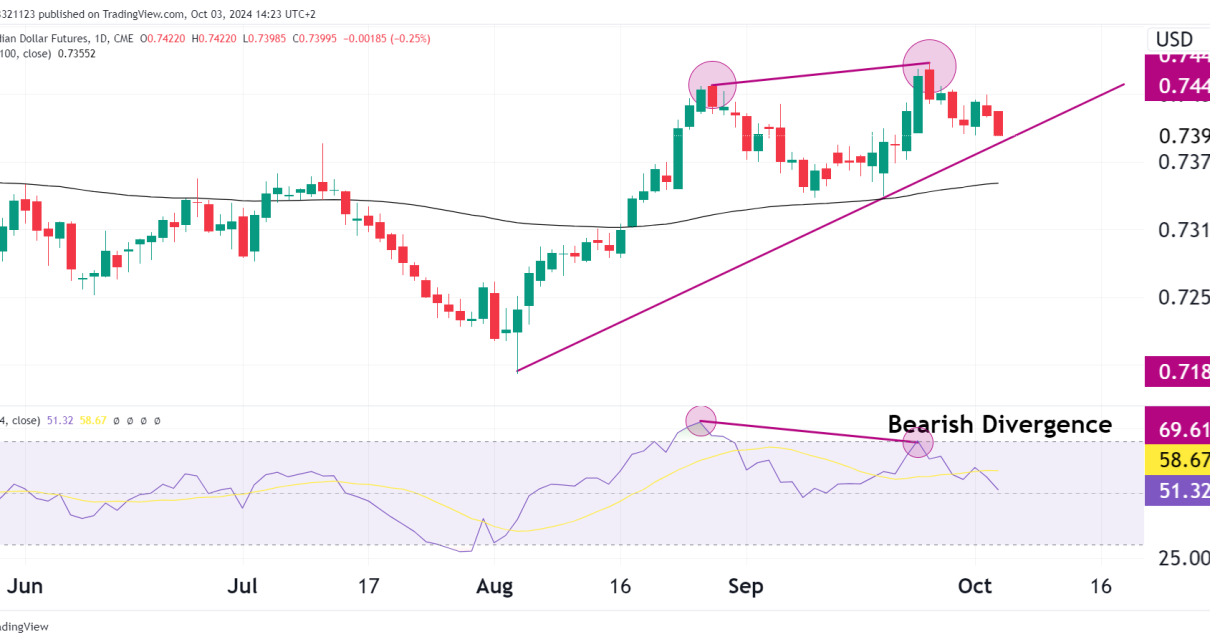
Technical Analysis

S&P 500 Futures (ES) hanging man?

Weekly On the weekly chart, there is a hanging man candlestick, which may lead to a reversal or a significant pause in the uptrend. Given the strong uptrend with 14 green candles in the past 16 weeks, we would need further confirmation before considering this a top. Volume has been relatively steady, without any significant Read More…

Strategies

Trend Trading Indicators and Strategies

What Is Trend Trading? Trend trading is one of the most popular strategies in financial markets, appealing to both novice and seasoned traders alike. At its core, it simply involves identifying and following the direction of market movements, which is why it is important to understand how to read trends correctly and if there is Read More…

Nasdaq 100 index futures (NQ)
Technical Analysis

Nasdaq futures (NQ) sell-off in volume spike

Weekly Chart The weekly chart shows a strong uptrend with the Relative Strength Index (RSI) reading above 60, this is still strong bullish momentum. The volume on the weekly has been consistent as the trend continues to make higher highs. For traders looking to join the uptrend, a pullback toward the RSI-based Moving Average (MA) Read More…

Fundamental Analysis

Equities End Mixed as All Eyes Turn to Consumer Inflation

US equities ended Monday mixed as investors prepared for the release of the all-important US consumer inflation report. The Nasdaq and the S&P 500 ended the day slightly lower. Meanwhile, the Dow rose slightly. Monday was a relatively quiet day for equities as investors mostly stayed on the sidelines awaiting the inflation report. However, the Read More…