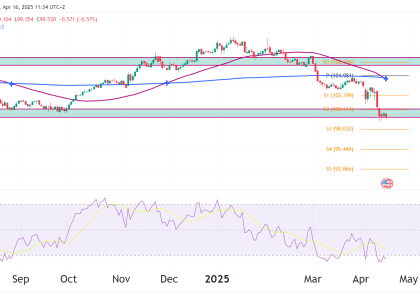
Currency futures fell on Friday after US data solidified bets for a smaller 25 bps September Fed rate cut, boosting the US dollar. Data throughout last week showed that the US economy remains resilient, dismissing fears of a recession. Fed rate cut bets (Source: Bloomberg) The dollar had a bullish day on Friday after the Read More…
Tag: stock market
Bearish momentum in DXY, short trade opportunity – watch 102 resistance
The chart provided displays the U.S. Dollar Index (DXY) on a weekly timeframe. Let’s analyze the technical indicators and identify potential bearish/short high-probability trade opportunities. Technical Analysis Descending Triangle Pattern: There is a symmetrical triangle formation. The price recently broke below the lower trendline of this triangle, signaling a potential continuation of the downtrend since Read More…
Bull & Bear Trades in S&P 500 Futures (ES)
Trend Analysis: The weekly chart for the S&P 500 (ES) futures has been surging alongside all other US equity markets since November of 2023. After a recent break below the trend line, the bulls stepped back in, and the price began its upward movement once more. We should not get euphoric though, there is a Read More…
Equities Slide as Nvidia Dips Ahead of Earnings Report
Equities ended lower on Monday as Nvidia fell ahead of its earnings report. However, rate-cut optimism lingered after Powell’s dovish speech on Friday. Meanwhile, investors were gearing up for the core PCE report for more clues on the outlook for Fed rate cuts. As investors worried about the upcoming earnings report, Nvidia lost 2.25% of Read More…
Will Gold Breach ATH Again?
Introduction Gold futures have continued their steady run upwards, boasting an impressive 31% return over the past year. The question is whether we see this trend continuing. Technical Analysis The daily chart shows us the 50-moving average positioned well above the 100-moving average. There is also a flag formation where gold sat sideways since the Read More…
Crude Oil Futures (CL) Double Bottom In!
Introduction A few days ago, we looked at CL, which was approaching a significant support zone at $72 per barrel. Price continued to fall and hit the support zone and bounced out with strength as bullish buy pressure surged. The daily chart now has a double bottom and a bullish candlestick pattern printed on it that Read More…