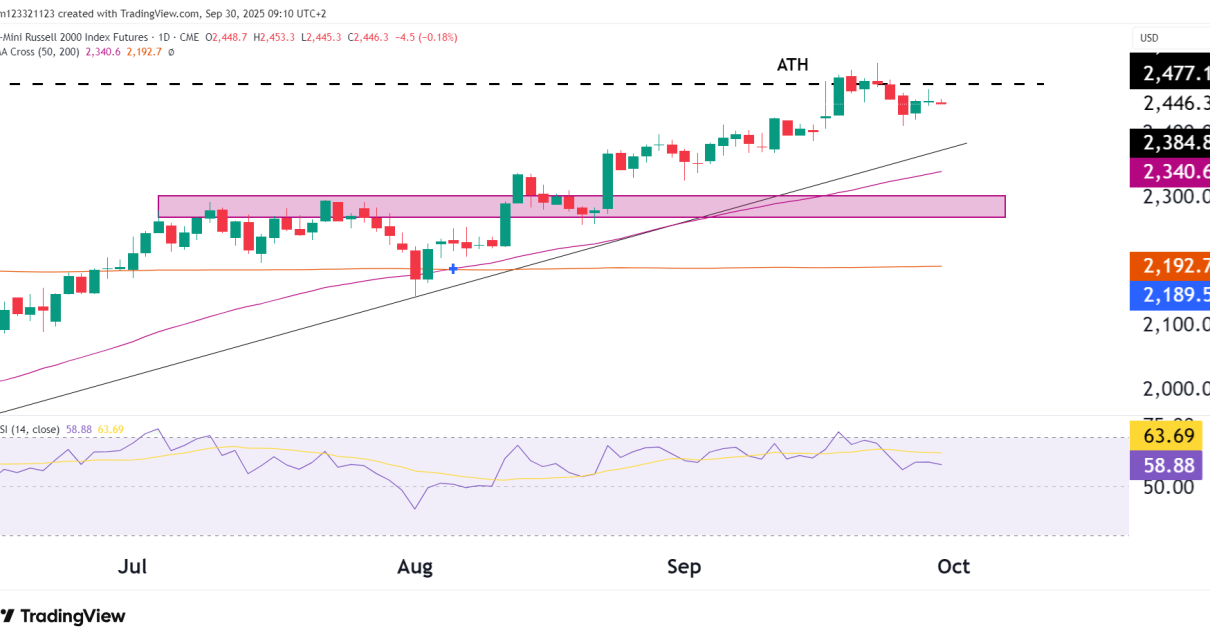
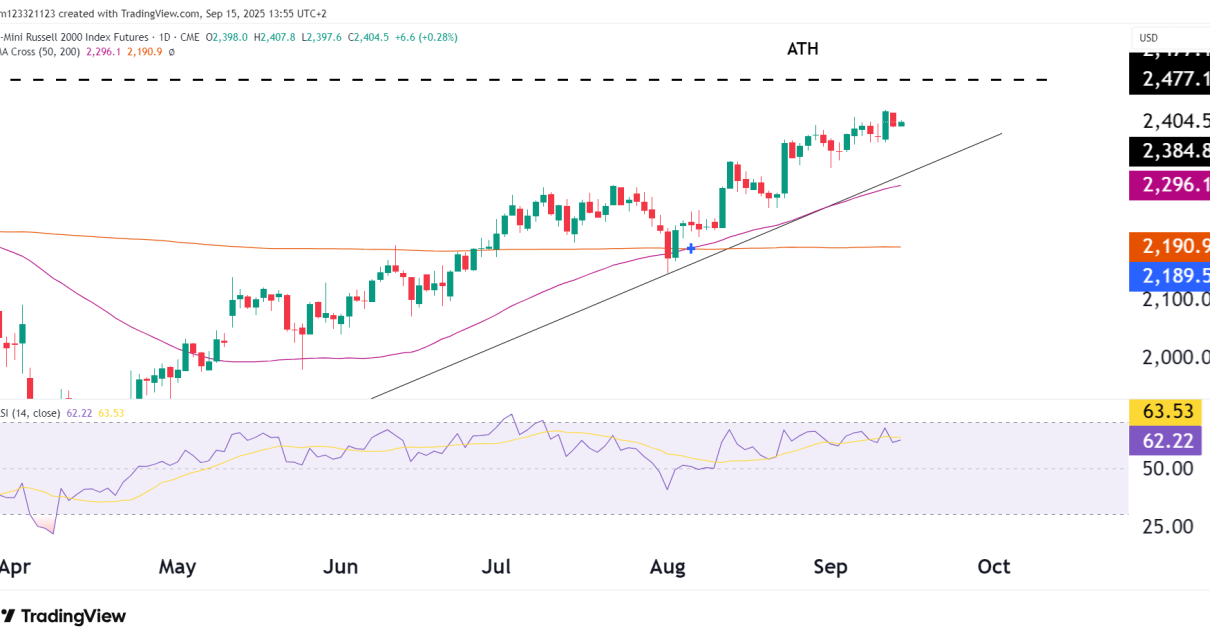
Introduction:The Russell 2000 Index (RTY), which tracks small-cap U.S. stocks, has been underperforming relative to the broader equity indices like the Nasdaq 100 (NQ) and S&P 500 (ES), despite a modest year-to-date (YTD) gain of 5%. In comparison, the Nasdaq is up 14.3%, and the S&P 500 is up 16.8% YTD. This underperformance in small-cap Read More…
Tag: russel 2000
Russell 2000 Futures could blast past ATH next week
Introduction We looked at the break out in RTY two weeks back, and now, the daily chart is forming a pennant chart pattern. The penant formation is a high probability chart pattern that can lead to a big swift move initially which is why we think we could see RTY break its ATH next week or the Read More…
E-Mini Russell 2000 Index Futures Technical Analysis
RTY Chart Overview In this analysis, we’ll take a closer look at the daily chart of the E-Mini Russell 2000 Index Futures, focusing on the potential head and shoulders pattern, support zone, and key technical indicators. Head and Shoulders Pattern The chart highlights a possible head and shoulders pattern, which could lead to a bearish Read More…
Russell 2000 Futures (RTY) Technical Analysis
RTY has refused to break out of its almost two year consolidation even as the bigger indices continue to make new highs. RTY has seriously lagged, is it time for it to catch up and finally break out of the consolidation zone or are we headed right back down? Weekly Chart Bulls need to see Read More…
Russell 2000 Futures (RTY) Technical Outlook
In the global markets, a cautious stance prevails as investors await the release of the U.S. consumer price inflation data for March. This anticipation follows a strong U.S. jobs report last Friday that exceeded expectations, fueling speculation about the Federal Reserve’s interest rate plans. Based on the inflation numbers, today’s news could send RTY higher. Read More…
Technical Analysis for E-Mini Russell 2000 Index Futures:
Russell has been severely lagging the big indices with 1 year performance at 7%, while NQ has posted a 47% increase in the same period. Is it finally time for the small caps to catch up? Weekly Key Levels to Watch on the Weekly: Daily Key Levels to Watch on the Daily: Potential Trades: Always Read More…