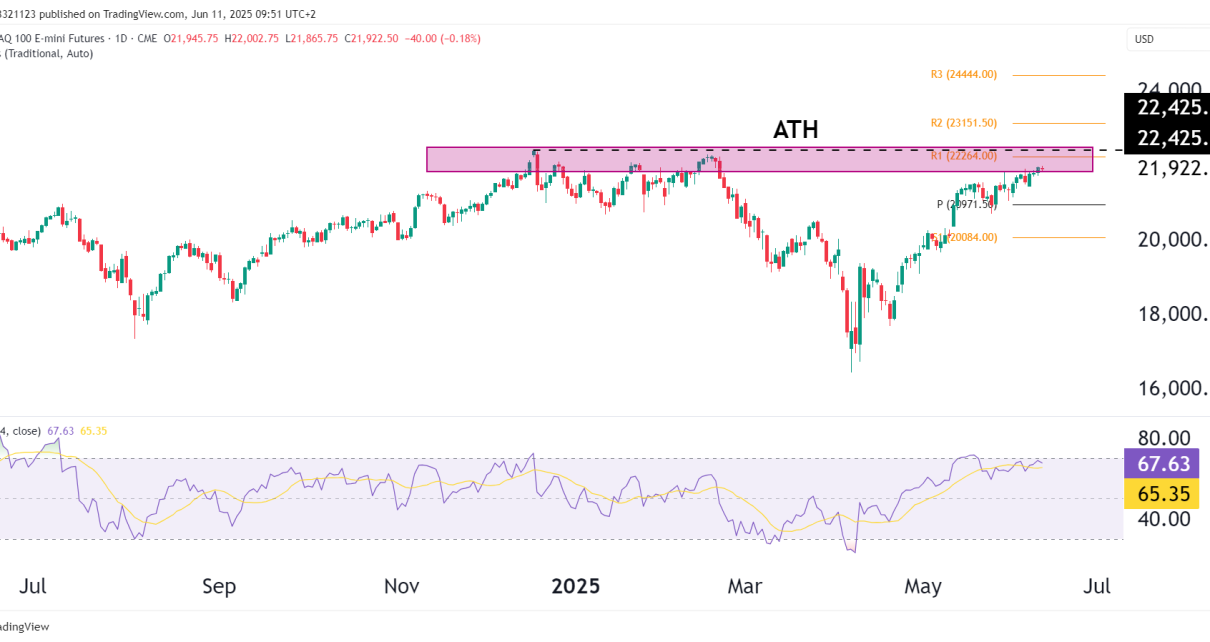
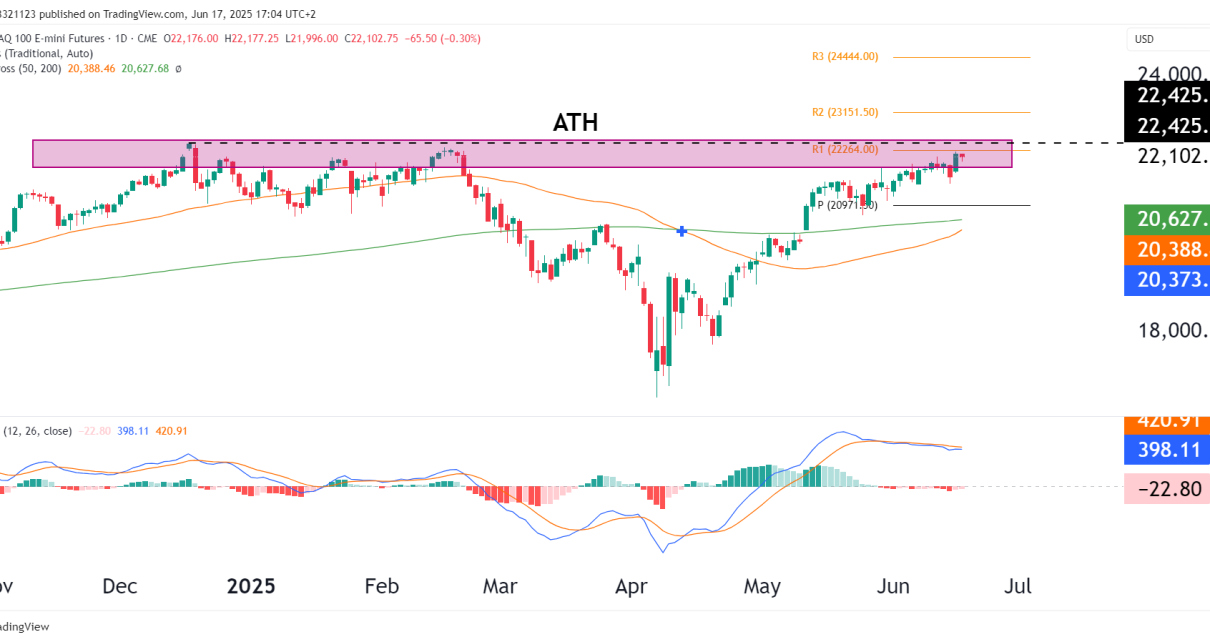
Technical Analysis NQ is currently stuck within a range that could be used as an opportunity to buy lows as the general market sentiment remains bullish. Once the bounce occurred on August 18th, NQ began moving sideways as traders who got in early were taking profits. Traders who missed the move have begun buying, hoping Read More…
Tag: NQ
NASDAQ Futures (NQ) Bulls Well In The Green
Recap August 18th was the last time we looked at NQ. The market was retracing after a strong bull trend that lasted the entirety of this year. Just as we expected, the drop was only a correction and provided us with opportunities to go long. The correction was much needed as the market’s most significant Read More…
Gold Futures (GC) Surge Out Of Support Zone (AS EXPECTED!)
Recap Two weeks ago, we looked at GC and the potential for price to first, fall within the support zone then bounce out of it. Gold rallied 1.57% on Wednesday, surging out of the support zone with tremendous conviction, but the question is whether we see the price testing the support zone again in the Read More…
Nasdaq (NQ) plunges as bullish trend channel breaks
Technical Analysis Bullish trend channel: The bullish trend channel on the daily chart has now been officially broken. There are a lot of stop losses getting triggered at this point for the traders who went long. Traders who have banked a solid profit from the near 50% rally in NQ for the past 10 months Read More…
What is the next move on Nasdaq futures (NQ)?
Recap The last time we looked at NQ was July 21st. Price was surging toward resistance at the all-time high of $16767. NQ dropped shortly after that article, not making another high since then. We have seen a healthy pullback of 5.7% since then, so the question arises, what is the best way to play Read More…
Nasdaq Futures (NQ) Technical Analysis: Strong Bullish Momentum Continues
Introduction: NQ has shown remarkable resilience, surging 53% since its lows in October last year and currently hovering only 7% below its all-time high. With the 50-day moving average sloping upward and the Relative Strength Index (RSI) sitting at 60, bullish momentum is evident. Moreover, the Accumulation/Distribution Line (ADL) is at 1400, indicating increased buying Read More…