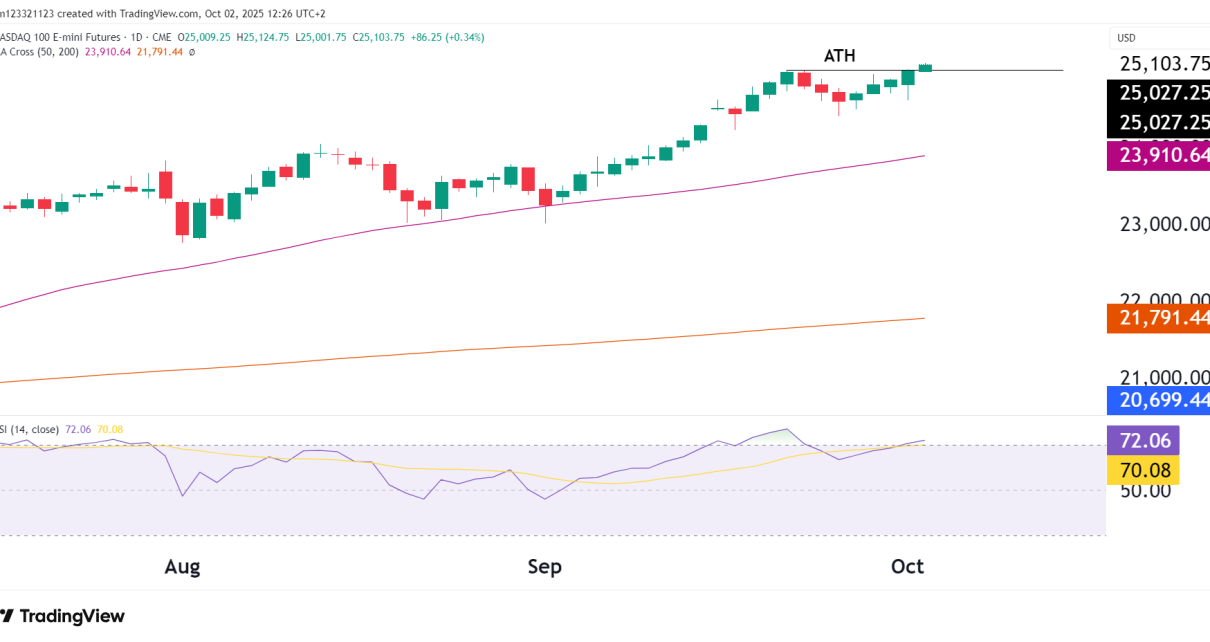
Weekly Chart Key Levels to Watch on the Weekly: Daily Chart Key Levels to Watch on the Daily: Potential Trades: It’s essential to monitor these levels and adjust strategies accordingly. The rising wedge and RSI divergence should be watched closely for signs of a potential reversal. Remember to manage risks effectively, as markets can always Read More…
Tag: NQ
Are Nasdaq futures (NQ) overbought?
Weekly Timeframe Analysis:On the weekly chart, we can see price has been in a solid uptrend since the beginning of the year. The Relative Strength Index is currently in overbought territory. Despite the overbought RSI, we should consider the prevailing uptrend as the dominant force until price action suggests otherwise. Daily Timeframe Analysis:The daily chart Read More…
New All-Time High In Nasdaq Futures (NQ)
Introduction NQ, like the rest of the world’s stock markets, is surging. Now trading at an all-time high. This week might be the first weekly close above the all-time high, which marks an incredible recovery after a 37% decline from its previous high back at the beginning of 2022. Let’s see what the charts tell Read More…
NASDAQ Futures (NQ) Eyeing New Records: Aiming for All-Time Highs
Introduction Today, we take a technical view of the NASDAQ 100 E-mini Futures (NQ) using both weekly and daily charts to identify critical price levels and trends. Equities are targeting all-time highs, and NQ is no different. Let’s see what the charts tell us and if we see all-time highs being hit by year’s end. Read More…
Are Equities Too Hot Right Now? Nasdaq Technical Analysis
Intro NQ has rallied 9% in a little over a week and is now only 4% away from all-time highs. With all the geopolitical mentions going on around the world it just shows that markets are 100% completely disconnected from reality. We are living in a ‘fake’ time and nobody is considering the risks that Read More…
Are The NASDAQ Futures (NQ) Over Sold? Technical Outlook
The market plunged last week, taking out key support levels as the daily chart resembles a rounding top formation. From here, the market still looks bullish in the medium to long term, but let’s take a look at the technicals and levels to watch for this week. You can see the $14,700 level, which was Read More…