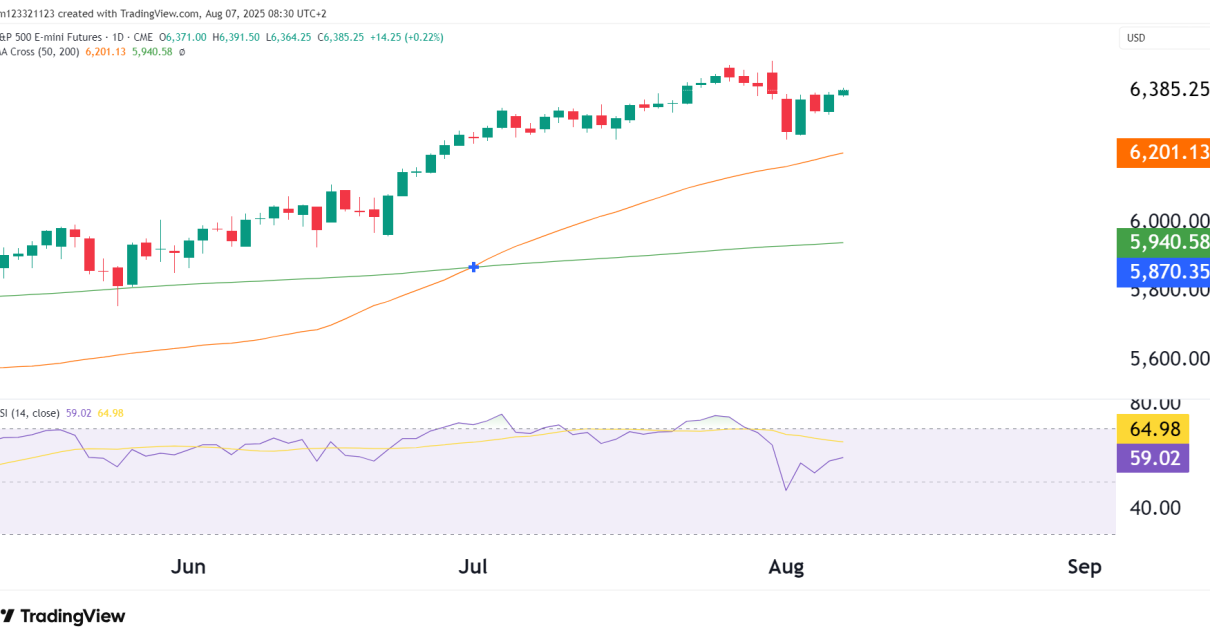
Equities rose on Monday, with the Nasdaq hitting record highs as market participants looked forward to the upcoming FOMC policy meeting. At the same time, investors absorbed mixed PMI data from the US that showed pockets of weakness and strength in the economy. The Federal Reserve will hold its policy meeting on Wednesday, and markets Read More…
Tag: futures trader
Currency Futures Slip on Adjusted 2025 Fed Rate Cut Expectations
Currency futures eased as the dollar extended gains after a strong week due to a drop in 2025 Fed rate cut expectations. Meanwhile, markets nearly fully priced a rate cut during the Fed policy meeting this week as inflation figures accelerated in line with expectations. December Fed rate cut bets (Source: Bloomberg) The greenback had Read More…
NASDAQ 100 E-mini Futures Daily Technical Analysis
Chart OverviewThe Nasdaq 100 E-mini Futures are showing signs of exhaustion at current levels, as the price action is forming a rising wedge pattern—a bearish signal when it appears at the top of a rally. With the price sitting near 21,800, the market appears stretched. Let’s break down what this could mean for traders and Read More…
Interest Futures Slide as 2025 Fed Rate Cut Hopes Dim
Interest futures wallowed near weekly lows as markets lowered the Fed rate cut expectations for next year. This shift came after US inflation data revealed a pause in the downtrend. At the same time, market participants expect the incoming Trump administration to make policy changes to boost economic growth and inflation. Interest futures have had Read More…
Oil Prices Surge Amid Growing Supply Worries
Oil prices rallied on Wednesday as supply concerns overshadowed demand concerns. Meanwhile, the recent efforts to boost China’s economy have supported prices. At the same time, US inflation figures came in line with estimates, solidifying bets for a December Fed rate cut. Market participants worried about supply on Wednesday after the European Union agreed to Read More…
Gold Futures (GC) Technical Analysis – December 11, 2024
Building on the November 25 analysis, where we saw a potential Head and Shoulders (H&S) forming, the updated chart tells a different story. The $2,542.3 “Last Support” held firm, and price action has invalidated the H&S pattern, leading to a false alarm on the formation. The bullish momentum has pushed prices back toward $2,707.6, so Read More…