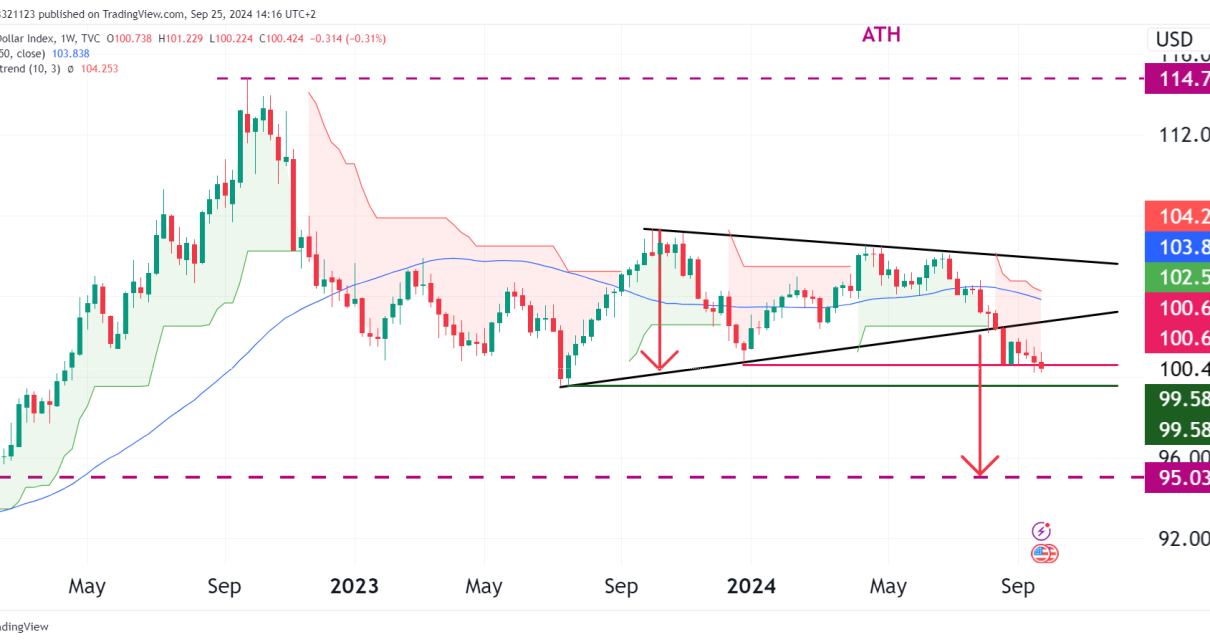
Strategies

What Is Divergence In Day Trading

One of the most valuable tools in a trader’s arsenal is the concept of divergence trading, especially in today’s markets. Divergence occurs when the price of an asset and a technical indicator, such as the Relative Strength Index or MACD, move in opposite directions. This can provide insights into the underlying strength or weakness of Read More…

gold
Economics

5 Gold Charts That Will Blow Your Mind

1. Gold Price Over Time This chart shows the historical trend of gold prices from 2000 to 2023. Over this period, the price of gold has seen a significant rally, with a notable rise around 2010, peaking at over $1,800 per ounce in 2011. This increase was driven by economic uncertainty and financial crises. After Read More…

Technical Analysis

NASDAQ Futures (NQ) Bearish Divergence?

Introduction The Nasdaq 100 futures are currently trading around 18,876.75. Over the past month, the index experienced a gain of approximately 5.76% since late April​ (Barchart.com)​. This performance is driven by strong corporate earnings from major tech companies like Nvidia and Microsoft, which have posted better-than-expected results. Nvidia’s surge of 9% following earnings and optimistic Read More…

Interest Futures
Fundamental Analysis

Strong US Economic Data Lifts Treasury Yields, Lowers Interest Futures

Interest futures ended lower on Thursday as Treasury yields soared after positive US data. The rally in yields came as market participants lowered bets on Fed rate cuts. PMI data and weekly jobless claims pointed to a still robust economy, raising fears that the Fed might further delay rate cuts.  US business activity (Source: S&P Read More…