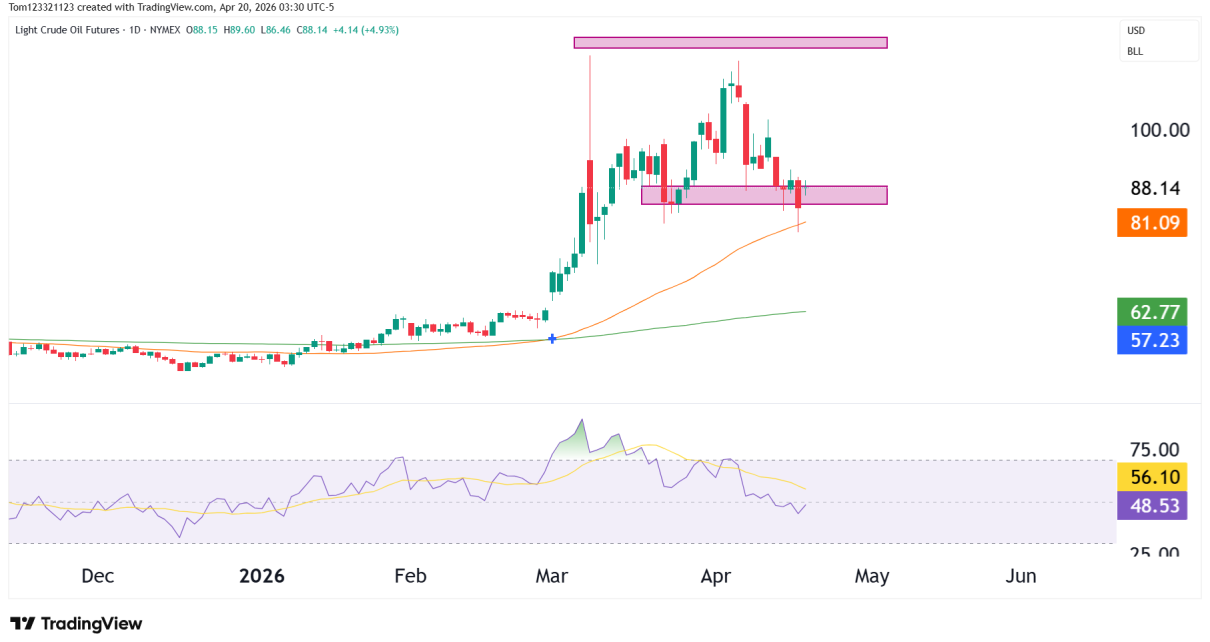
Starting with the weekly chart, the Relative Strength Index (RSI) is hovering around 63.11, which is above the midline but below the overbought threshold of 70. This suggests that while the market has bullish momentum, it is not yet in extreme territory where we might expect a pullback. The RSI-based Moving Average (MA) is slightly Read More…
Tag: Futures market
Gold Halts Decline, Gears Up for US Non-Farm Payrolls
On Thursday, gold stabilized after a four-session decline as investors prepared for the upcoming US non-farm payroll data. This report could impact the Federal Reserve’s interest-rate decisions. Jim Wyckoff, senior analyst at Kitco Metals, mentioned the need for a fresh spark in the gold market to start a rally. According to Wyckoff, stronger jobs data Read More…
EURO FX futures (6E) bulls & bears fight it out
Weekly Chart Analysis:The weekly chart shows the price fluctuating within the Gaussian channel. The recent trend is sideways, with the price fluctuating between the upper and lower bands of the channel. The ‘Higher High’ (H) and ‘Lower Low’ (L) indicate a lack of a clear long-term trend. The RSI is at 54.37, which is neutral, Read More…
Oil Prices Rally 3% on Global Supply Disruption Concerns
On Wednesday, oil prices rose approximately 3% due to a disruption at Libya’s primary oilfield. This incident heightened concerns about potential disruptions in global oil supplies. Moreover, there were escalating tensions in the Middle East. Oil rose for the first time in five days, marking the most significant daily percentage gain for WTI since mid-November. Read More…
E-mini S&P 500 Futures (ES) multi-timeframe analysis
Weekly Chart Analysis:The price is currently above the Gaussian channel, showing a bullish trend over the long term. However, we should note that there are all-time highs (H) that could act as resistance. The RSI is at 64.40, indicating that the market is neither overbought nor oversold, giving us room for potential price movement in Read More…
T-Bond Futures (ZB) technical analysis
Weekly Chart Starting with the weekly chart, the Gaussian channel is signaling a bearish trend as the price is trading below the midline of the channel. This can be interpreted as a downward pressure on the price. The Gaussian also turned red in the middle of 2021 and has been that way since. The current Read More…