NQ
Technical Analysis

Nasdaq 100 Futures (NQ) – Technical Analysis 6 January 2026

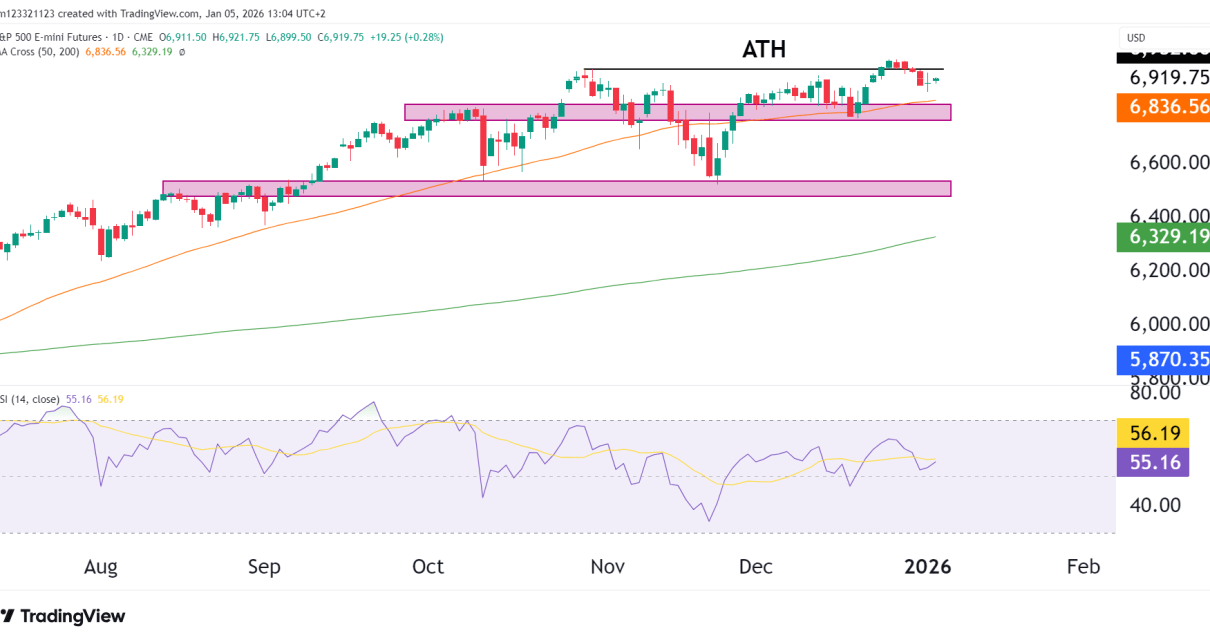
Introduction The long-term NQ trend continues to the upside along with the other US index markets. The price has been consolidating, however, since hitting an ATH of 26,399 in November, and a symmetrical triangle is now forming. Traders and investors are watching U.S. inflation data, labor market reports, and the FOMC, and any bullish developments Read More…

S&P 500 Chart
Technical Analysis

S&P 500 (ES) – Technical Analysis 5 January 2025

Introduction ES continues to consolidate just below all-time highs, with bulls pushing the price up after each pullback. The 50 moving average is still holding as support, and as long as bulls maintain that, the momentum is firmly on the upside. The market is closely watching U.S. inflation data, labor market reports, and FOMC but Read More…

Weekly chart DXY
Technical Analysis

U.S. Dollar Index (DXY), Technical Analysis 2 January 2026

Introduction The Dollar index (DXY) dropped 9.3% in 2025, mainly due to the U.S interest rate advantage fading as global growth and risk appetite improved. This meant money flowed elsewhere. It has also been a factor that has helped US indices to rally, with the S&P 500 rallying 16.8% for the year. Let’s take a Read More…

funded trader raymond oneupt rader funded trader program
Technical Analysis

Raymond Loves OneUp Trader After Withdrawing $17,200

Introduction Raymond, a 53-year-old momentum day trader from Bowie, United States, earned his funded account on April 21, 2025, after completing his evaluation in just 10 days. A loyal member of the OneUp Trader community since 2019 trades the $50,000 account, and his results show the payoff of a simple process, patience, and strict risk Read More…

gold technical analysis oneup trader funded trader program
Technical Analysis

Gold Futures (GC) Technical Analysis, 30 December 2025

Introduction Gold continues to trade within a strong uptrend, with price consolidating just below recent all-time highs (ATH) after another bullish impulse. Price is also breaking above the ascending triangle, but has pulled back to test the horizontal support level. Despite this short-term volatility near the highs, the broader technical structure remains constructive, with buyers Read More…

S&P 500 technical analysis
Technical Analysis

S&P 500 (ES) Technical Analysis, 29 December 2025

Introduction The S&P 500, along with all other US major markets, has staged an impressive rally this year. ES is likely to close near all-time highs, up 17% YTD. Easing inflation and Fed expectations have been the main drivers for the rally this year, as well as positive earnings from mega-cap stocks. As we come Read More…