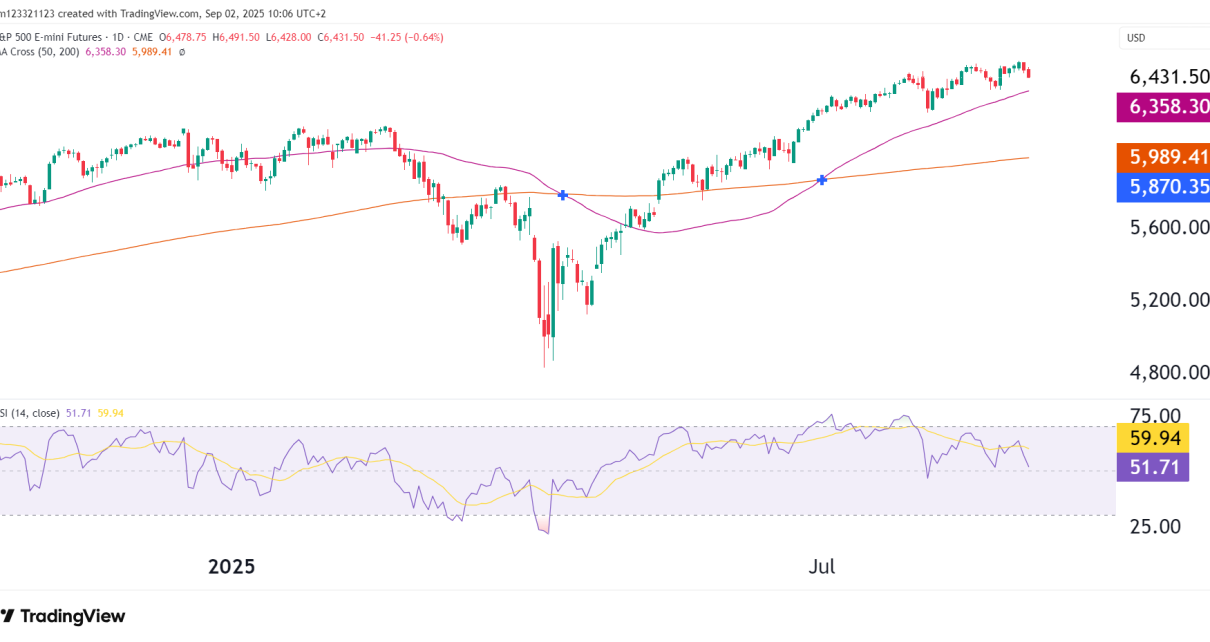
Introduction As we march forward into the latter part of Q1, we have exciting news for our affiliates! Our Beginner Trading Course is now available as a part of the affiliate commission structure. OneUp Trader Affiliate Program Earn Up To 25% Commission on EVERY Subscription and RECURRING Subscriptions Making money as an affiliate partner is Read More…
Tag: E-mini S&P 500 (ES)
S&P 500 futures (ES) Bullish Reversal Candle
Introduction S&P 500 E-mini futures (ES) have shown signs of stabilization following a sharp break below the long-term trendline. The latest price action has formed a bullish inside day, so there is potential exhaustion of the recent sell-off and the start of a short-term rebound. As of today, ES is trading at 5,977.25, up +0.23%, Read More…
S&P 500 (ES) Break Trendline—Trend Reversal or Buying Opportunity?
Introduction S&P 500 E-mini futures (ES) have broken below their rising trendline support, signaling a potential shift in market structure. After failing to break the all-time high (ATH) at 6,154.75, price has pulled back sharply, testing key support zones. As of today, ES is trading at 6,004.75, up +0.57%, attempting to stabilize after a significant Read More…
Furkan Withdraws Another $12,800 in Just 9 Days
Introduction In October 2024, we shared the remarkable story of Furkan, a young economics student from Germany who had achieved an impressive $24,700 in withdrawals through the OneUp Trader funded program. Today, we’re excited to bring you an update on his trading, as he has withdrawn another $12,800 across three funded accounts in just nine Read More…
S&P 500 ATH on the Cuspe of Bullish Break
Introduction S&P 500 E-mini futures (ES) are trading just below their all-time high (ATH) of 6,154.75. As of today, ES is less than 0.2% away from ATH. A breakout above 6,154.75 would confirm the next leg higher, with a measured move target near 6,455.25. Market Drivers & Key News Events Technical Outlook ATH Test Bull Read More…
What is VWMA Indicator Explained
Introduction to the VWMA The Volume Weighted Moving Average (VWMA) is a powerful technical analysis tool that provides a more accurate representation of an asset’s average price over time compared to a simple moving average. By incorporating trading volume into its calculation, VWMA gives greater weight to periods with higher trading activity, painting a clearer Read More…